A Practical Example of No-Code AI Integration
One of the last obstacles to deploying AI is operationalizing the outcomes. Qualetics has simplified the process by making our live analytics and AI results available to over 6,000 SaaS applications via our Zapier integration streamlining your ability to connect real-time insights to the processes and tools you already have in place.
Building on an example shared in a previous blog post where Qualetics analyzes application activity to detect errors in real-time, this no code integration through Zapier allows you to automate taking action as they occur by directing them to tools you use in your current workflow.
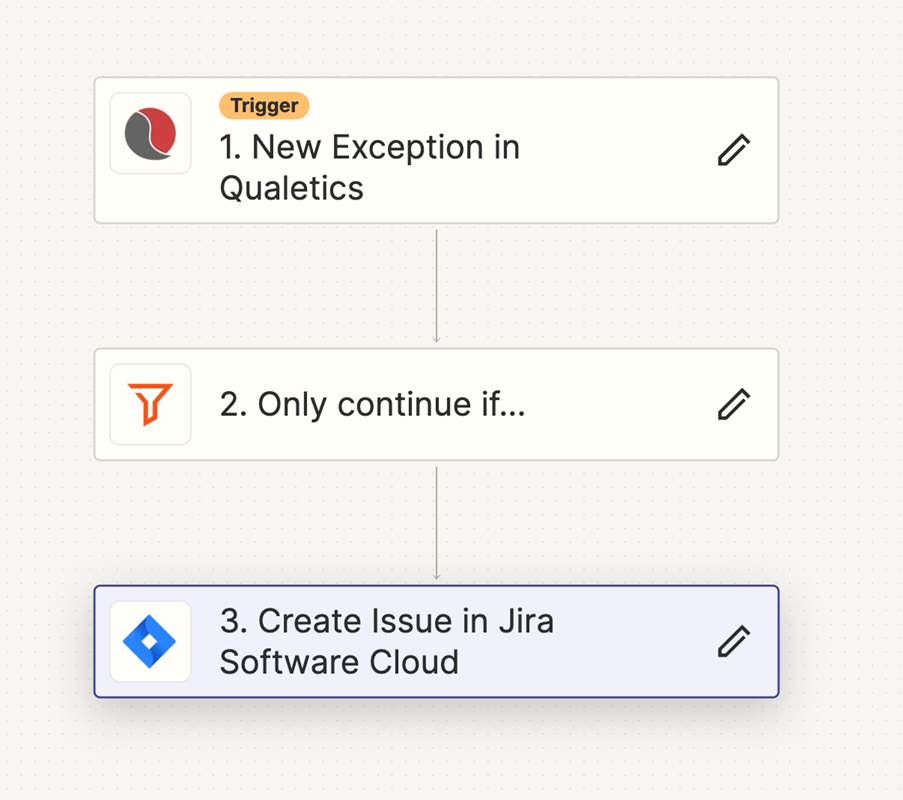
The example below steps through how you can direct critical (or even non-critical) application errors identified by Qualetics (using our proprietary Error Severity Detection AIgorithm on your application activity data) to your issue tracking process for attention.
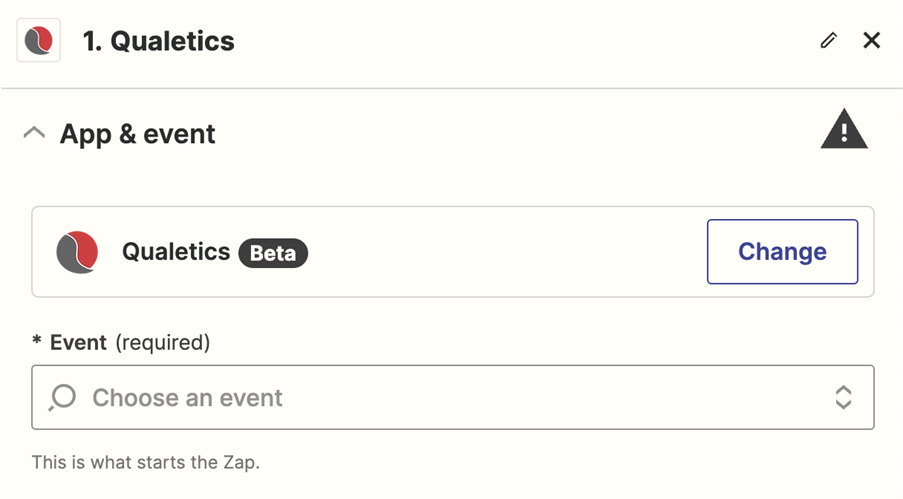
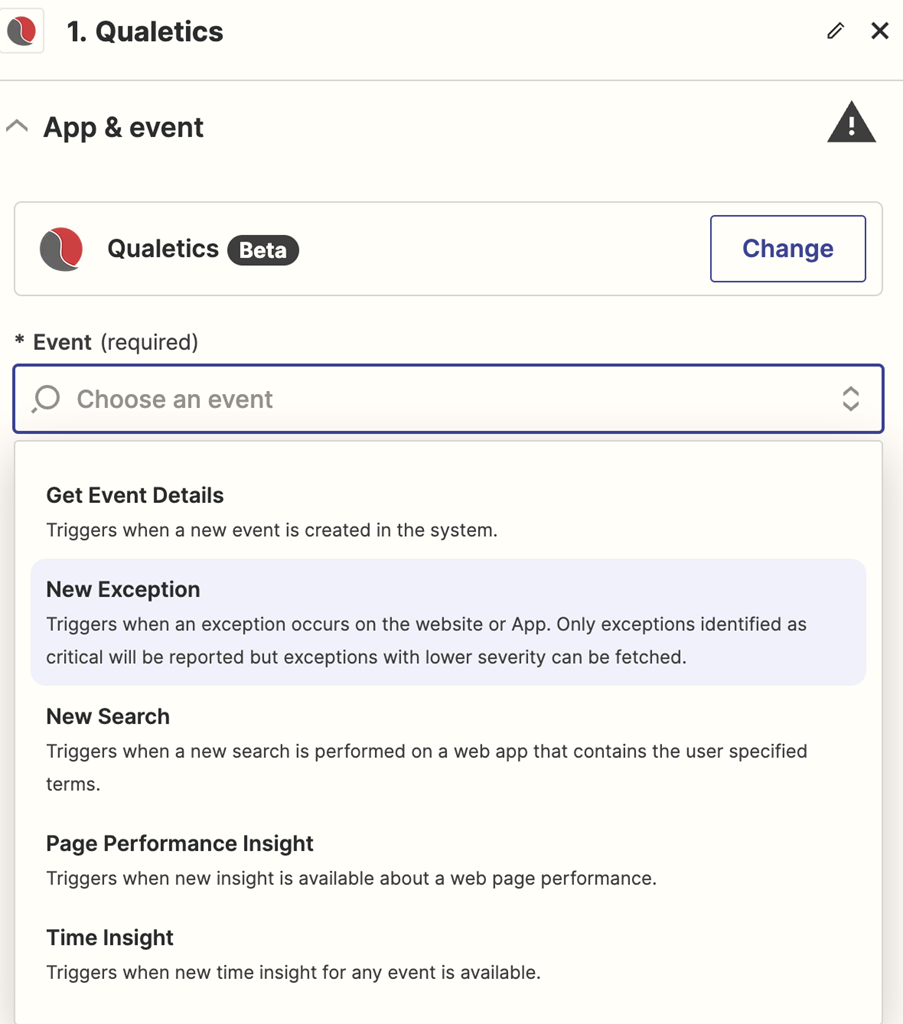
In this case we’ll be sending the identified application errors to Jira Software Cloud, but it could be any issue tracking or project management tool you use that is supported with a Zapier connection such as Slack, Zendesk, Redmine, Asana, etc. The illustration below the Qualetics application was selected as the data source with the next illustration showing the trigger defined as an Exception trigger to be passed.
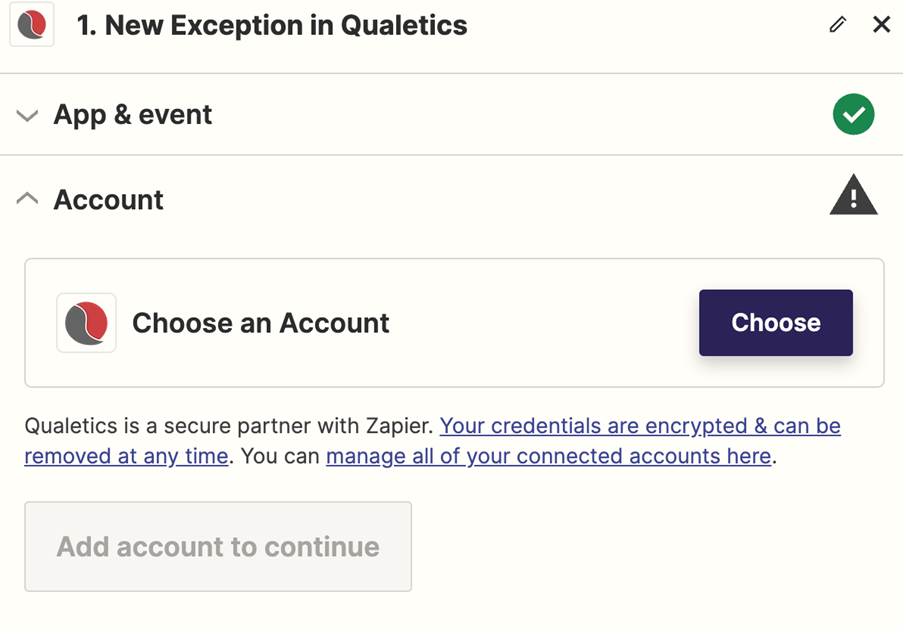
Zapier then asks you to enter your Qualetics credentials to connect to your account and the data that will be triggered with your Zap.
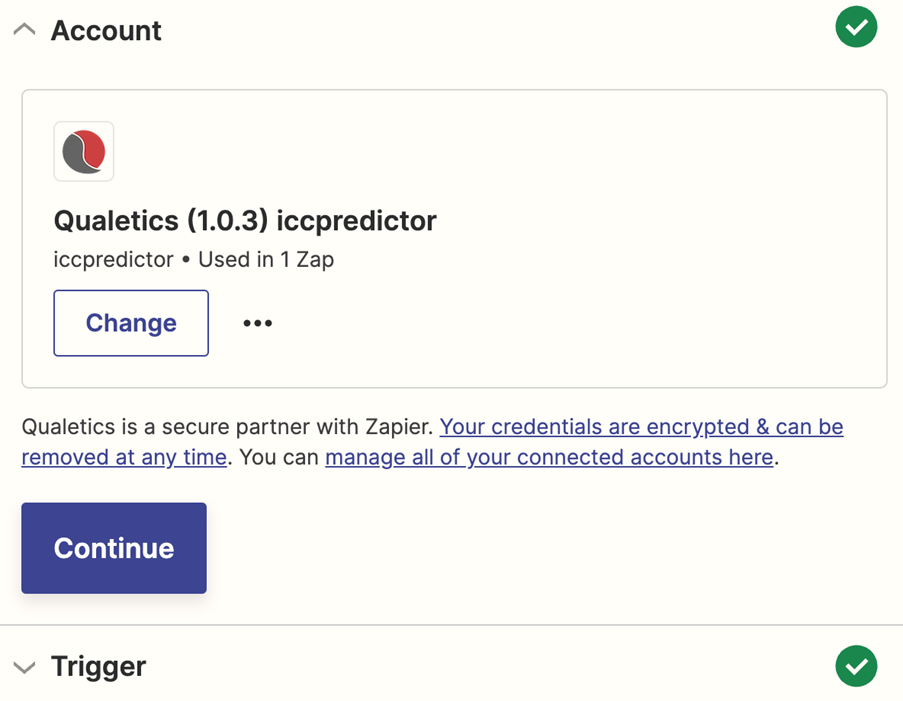
Zapier confirms your credentials were accepted. In this example we are connecting the errors generated from an industry classification code predictor available through Qualetics (available here) but in practice this would be whatever application you are monitoring through Qualetics.
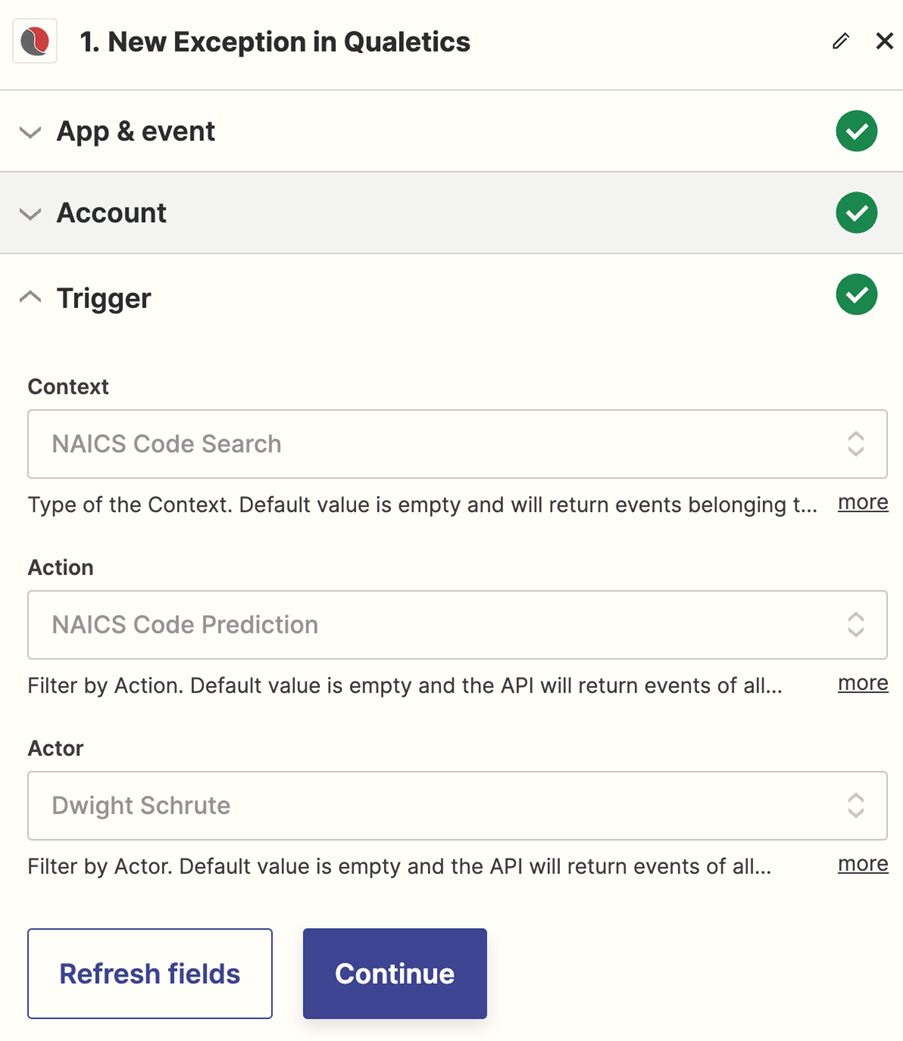
We can now move onto configuring the trigger details.
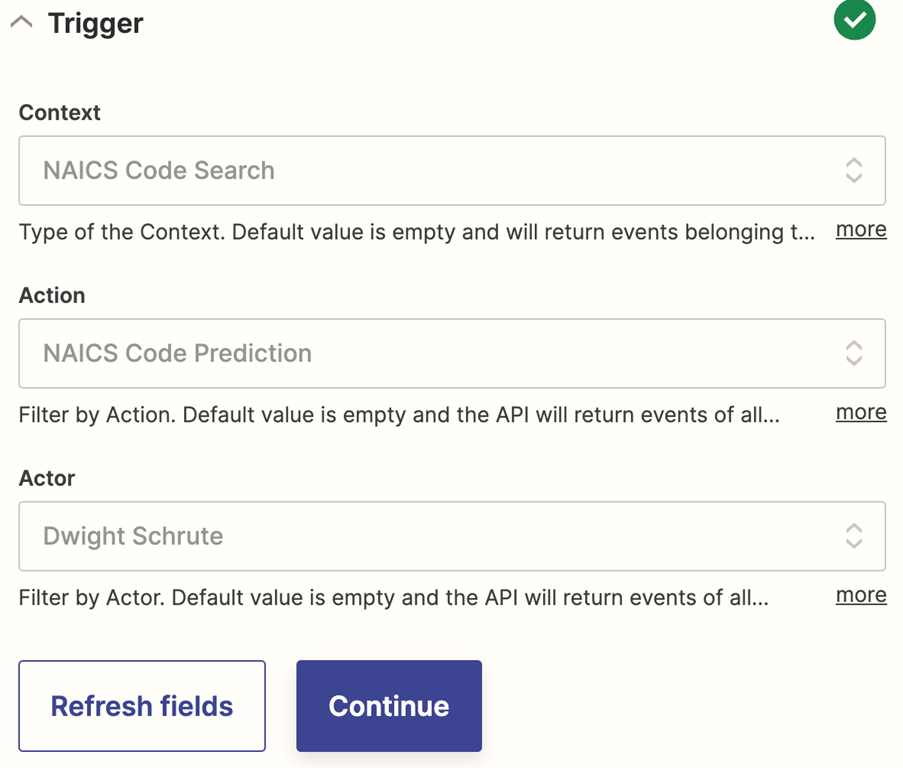
Context is a specific feature within the application that this trigger will monitor for. Action will be any kind of action performed within the feature of your application. Actor will be any user, or group of users that you want to monitor for performing the action. Expound on why this is an intelligent approach to filtering for data being passed for analysis. So, in the example above, we’re applying filters in order to limit the tracking to a specific action (NAICS Code Prediction), under a specific context (NAICS Code Search) for a specific user (Dwight Schrute). This limits the data to be retrieved associated with these specific filters.
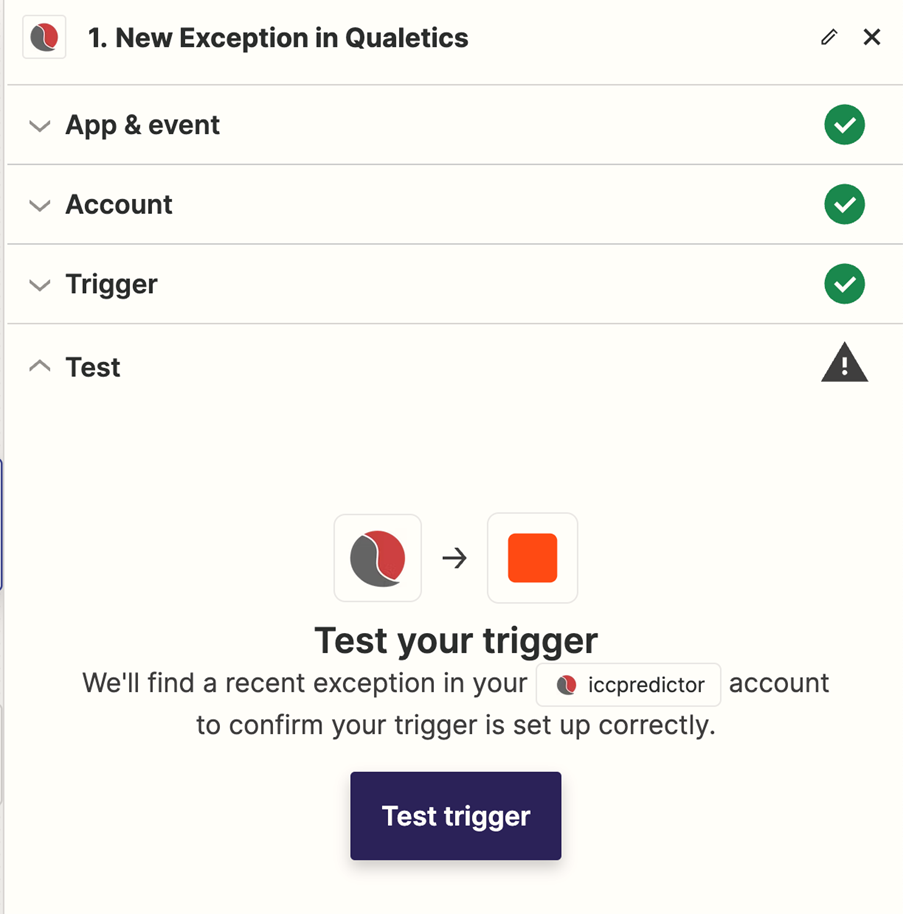
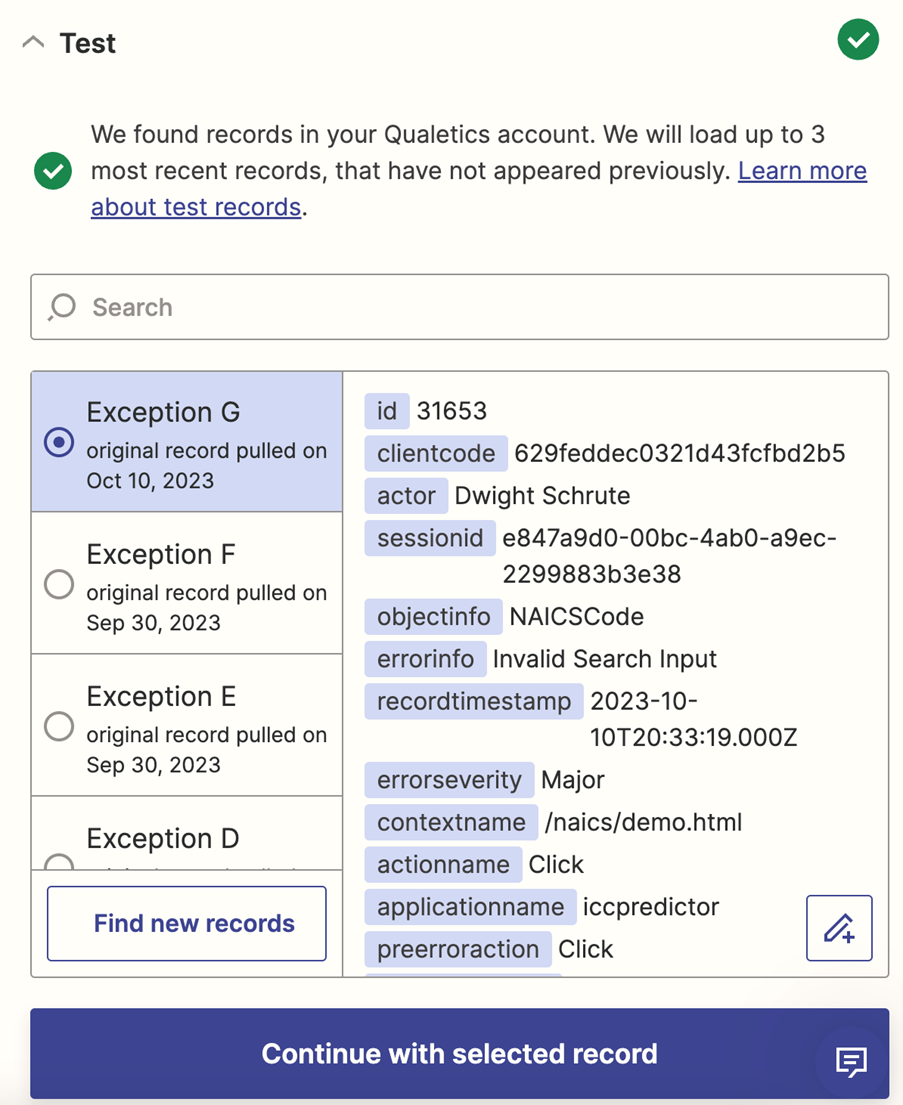
Once the application is selected and the analyzed result to be passed has been defined you can test the connection to see the kind of data that will be passed. The example below shows the last three exceptions that were passed that meet our criteria and the information that will be transmitted.
You can then define filters. In this case we want to avoid flooding the issue tracker with multiple errors of the same type. The filter below passes an error that occurs the first time the error has been identified as being critical or major which the error algorithm determines when it has seen this error impacting either many users, or on an important part of the user experience such as a check-out procedure in an ecommerce application or a course enrollment or completion step in an e-Learning management system.
![]()
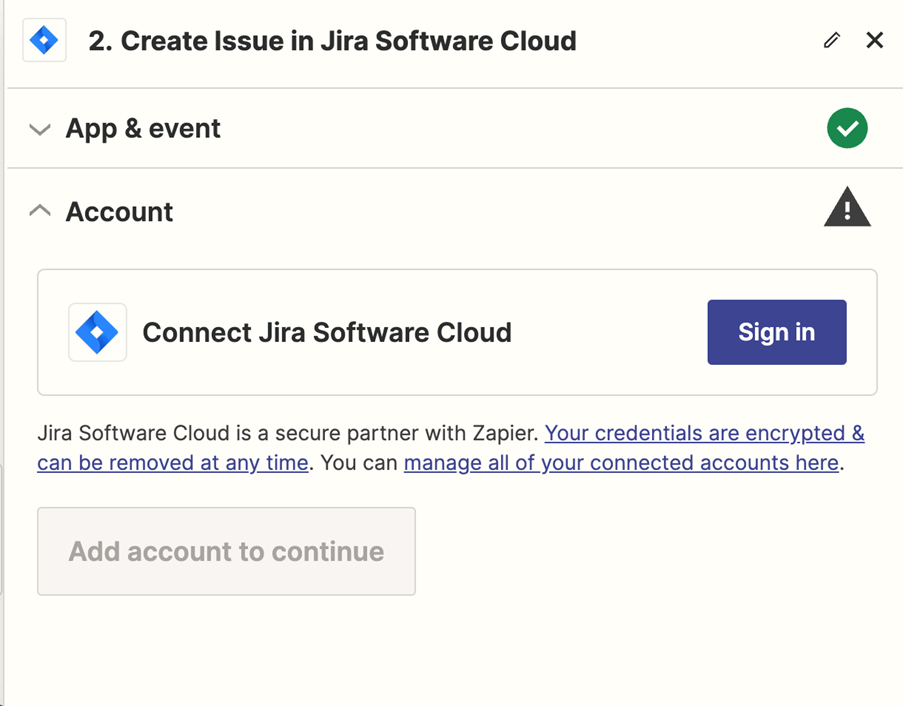
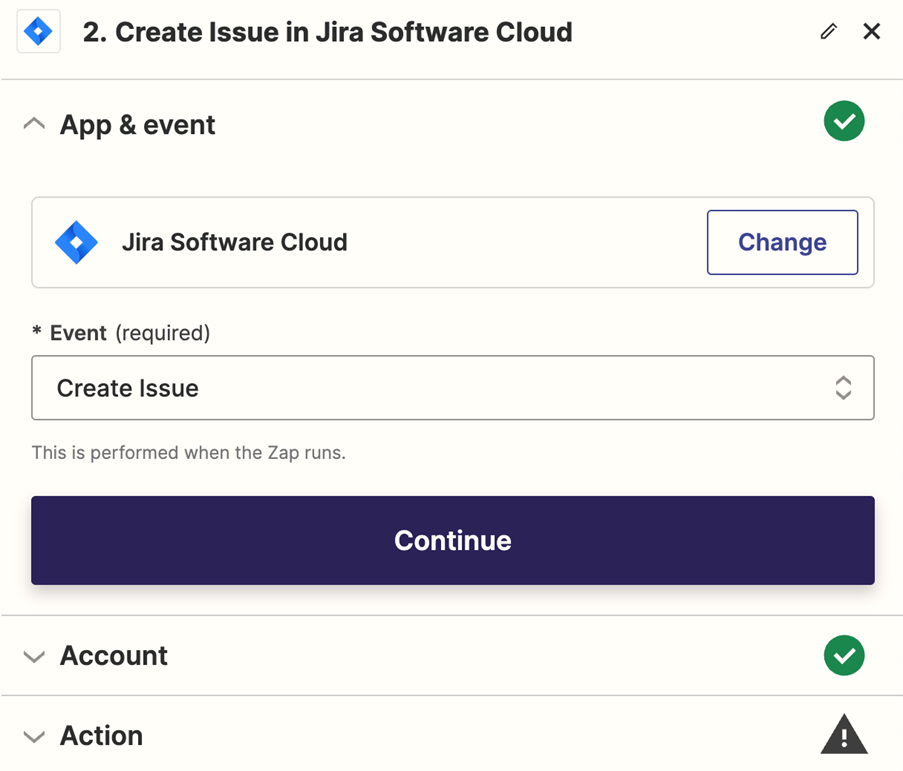
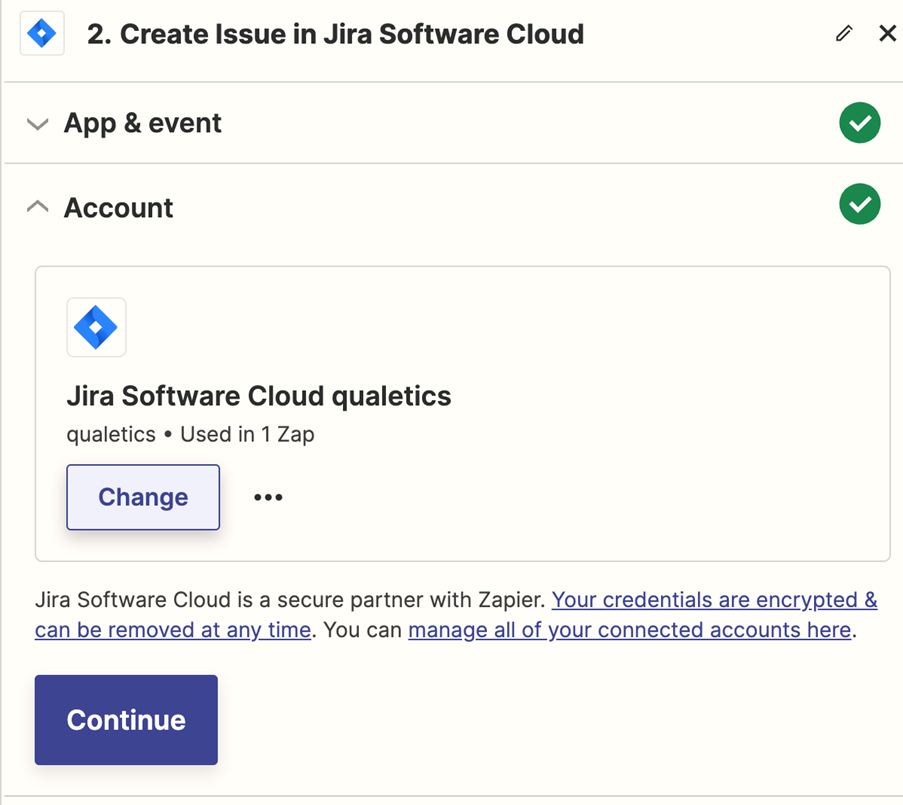
We can then proceed to connect the analyzed results to the issue tracker software. In this example we are using Jira Software Cloud so we would enter and validate our Jira credentials.
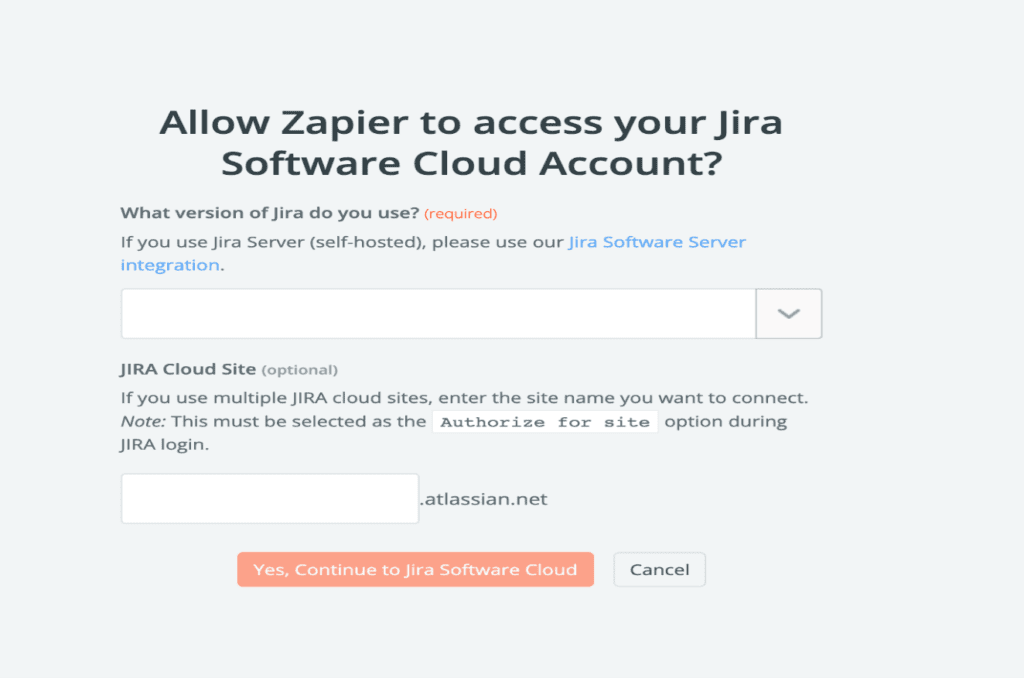
Jira’s Zapier interface then picks up, guiding you through the process of creating the Jira notification and instance.
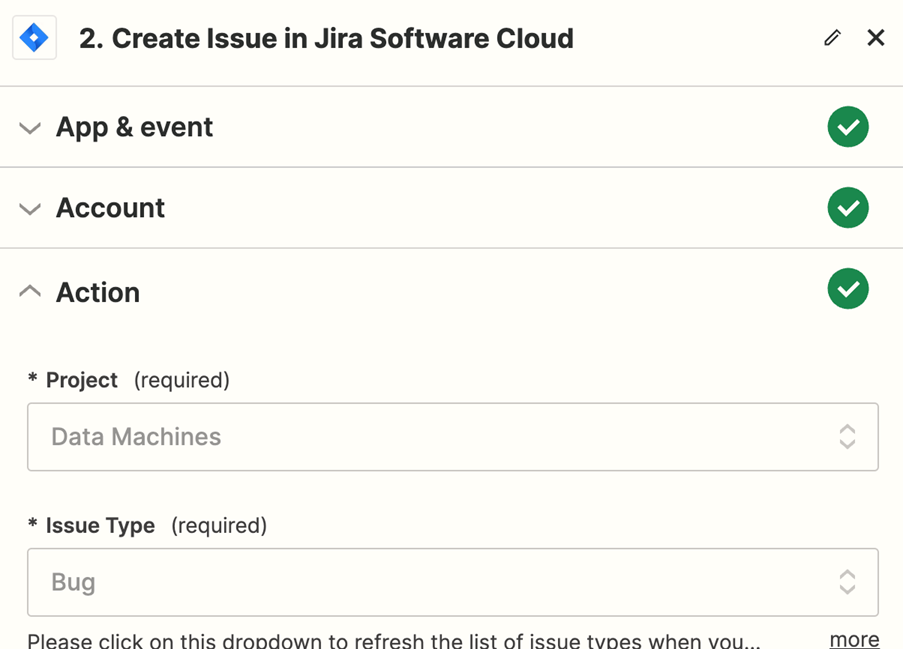
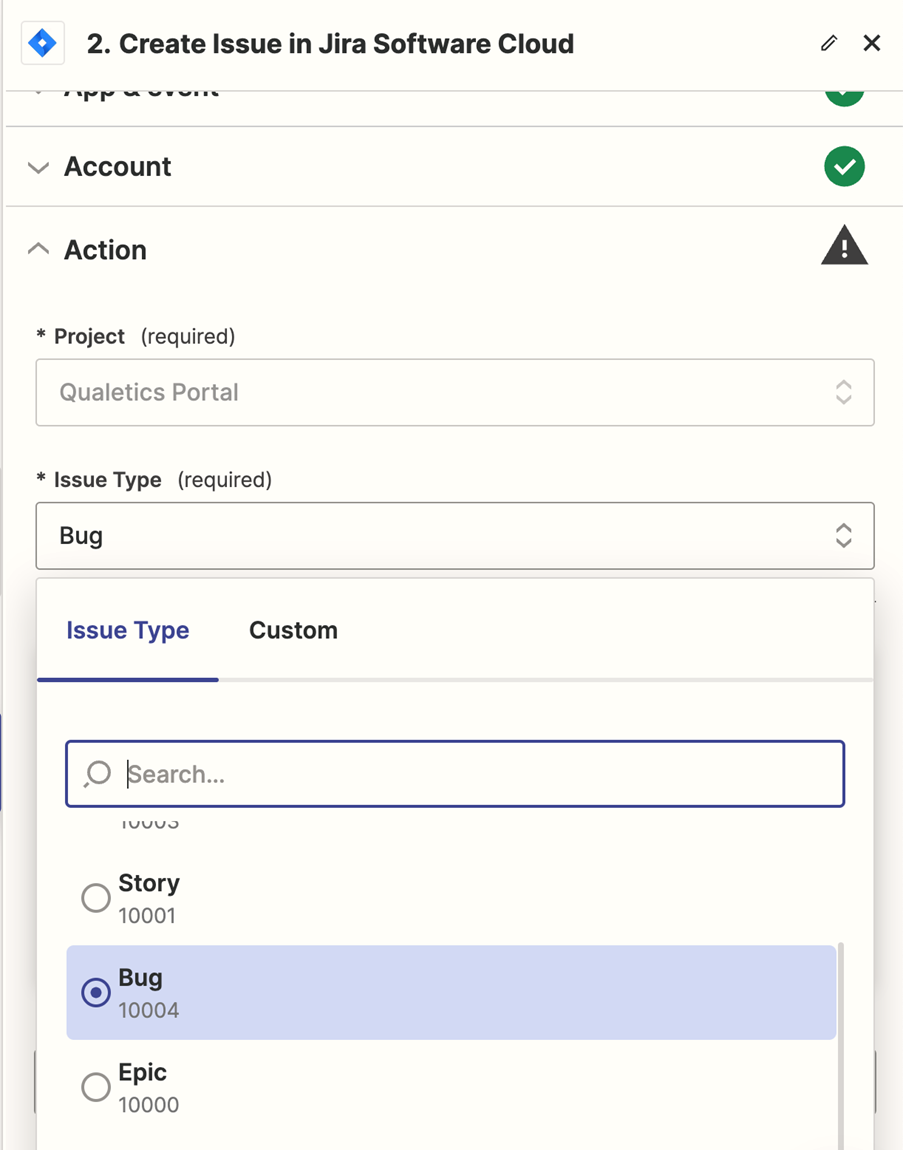
Below we are labeling the project and issue type that will be recorded in Jira and will contain the error details passed to Jira from Qualetics.
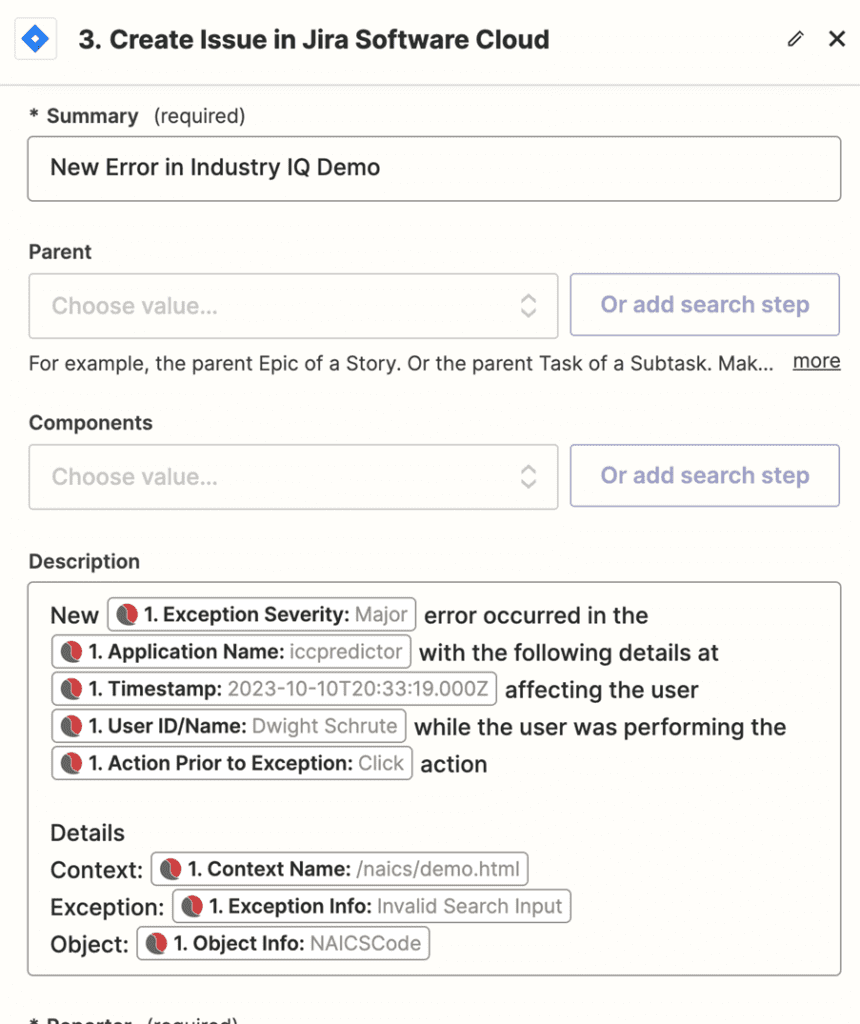
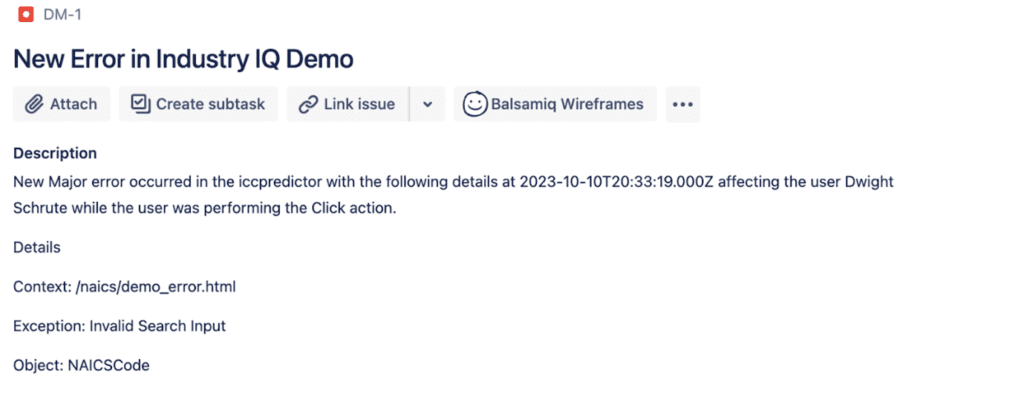
The illustration below shows how the Qualetics information will be presented in the Jira ticket.
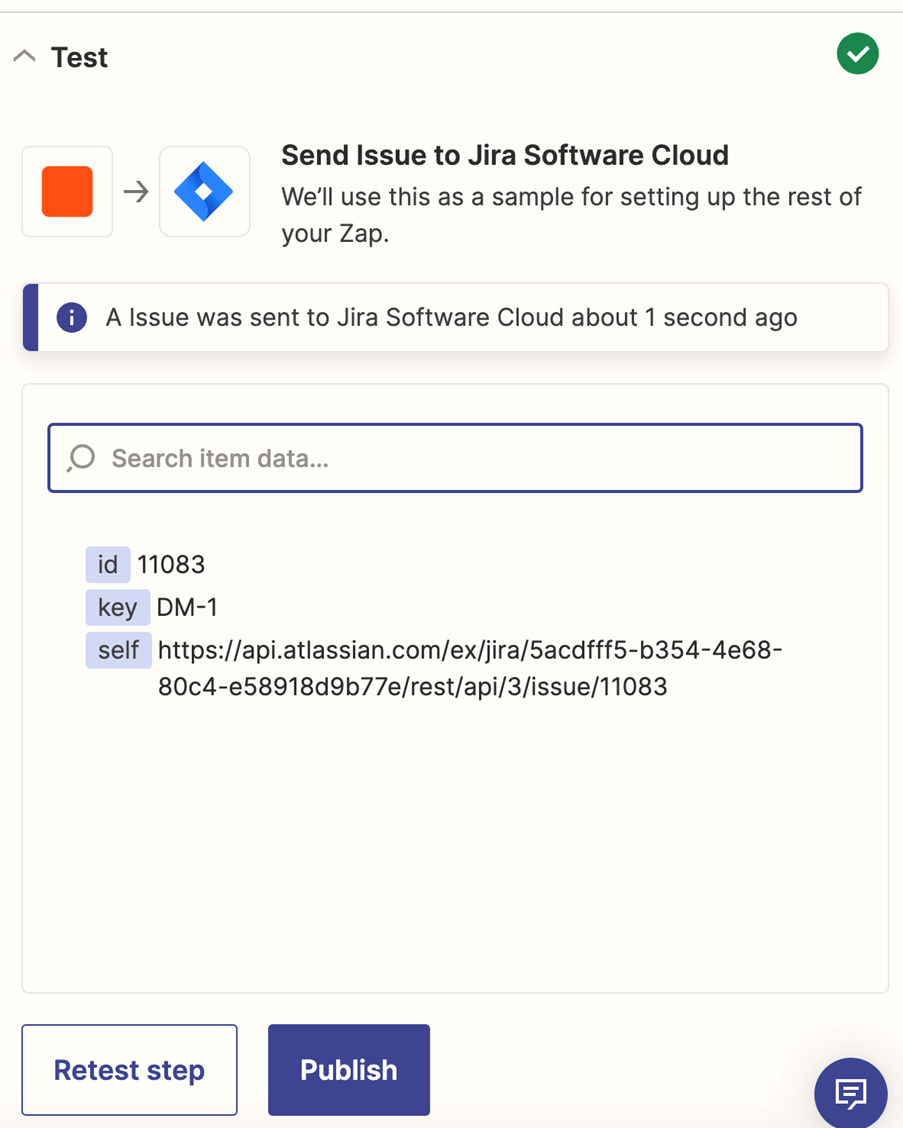
And this shows that an issue ticket was passed into Jira.
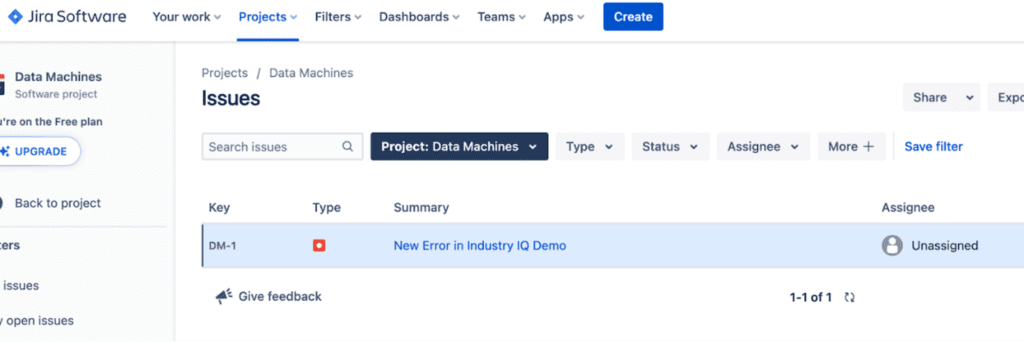
And clicking on the ticket shows some of the detail that was passed though there is more detailed information that can be passed including the information in the test data illustration above.
Below is the Zap template now available for Qualetics customers simplifying the setup of passing a Qualetics error “exception” to Jira.
- Use our Free Trial
- Create your account
- Connect your app’ to Qualetics
- Select any of the details you want to extract from your Qualetics insights
- Connect them with any of the 6k+ app’s available through Zapier
Operationalizing AI has never been easier. If you are already a Qualetics customer, you may already be integrating results with our API capability and now you have a simplified no code integration option.
If you aren’t a Qualetics customer yet and want to learn more, feel free to contact us here or schedule an appointment.