How do you Improve Customer Experience Quality?
Welcome to the Qualetics’ Software Intelligence Series! This post will focus on ways to derive and communicate insights that help you proactively manage your software quality and customer experience. A common question for any organization that relies on its software to manage at least part of its customer experience is “How is our software doing?” Here’s how we answer that question at Qualetics.
How do you measure software quality?
Ideally, you could answer that with an objective, fact-based, simple-to-understand measure. The “Quality Index" gauge above is a visualization we’ve adopted to display on a scale of -5 to +5 how our customer’s software is doing (SaaS software, mobile apps, website). This score is derived from the following five factors weighted in descending order: (Anticipating your question “where do these come from?”, these are actual examples taken from the implementation of Qualetics’ AI-based software quality plug-ins. Our description offers the logical framework for how you can derive similar decision-support either by extracting them yourself or by implementing our plug-ins).
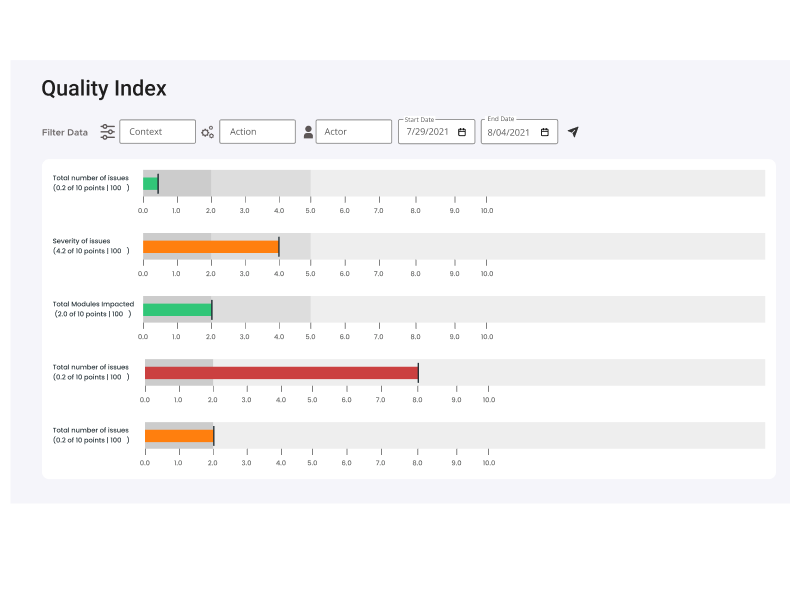
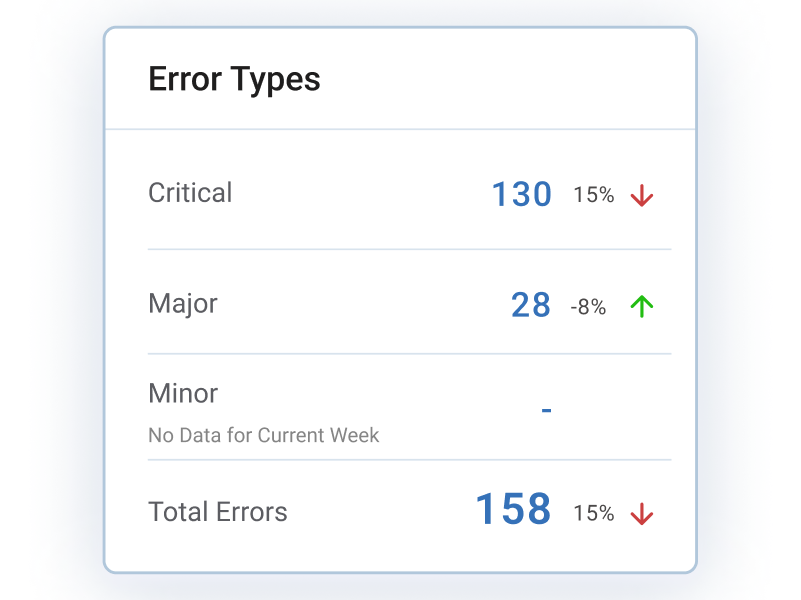
Error Types: Of the errors that are occurring in your software experience, how many are considered critical, how many are major, and how many are minor? The score above indicates a software experience that is heavily weighted toward minor errors.
Users Impacted: Of all the users of your software, how many are actually impacted by the errors that are occurring? In this case, a relatively low number of the overall user population.
Error Frequency: This indicates how frequently the errors are occurring. Again, this software is performing quite well with a relatively low-frequency rate.
Context Impact: “Context” is the portion of the user experience that is impacted by the prevalence of errors and how important that portion of the user experience is to the software’s purpose. For instance, if this were an eCommerce-focused website this may indicate that the errors that are occurring impact the checkout process. So though the errors are minor and don’t happen often, they may be occurring at a critical part of the user experience.
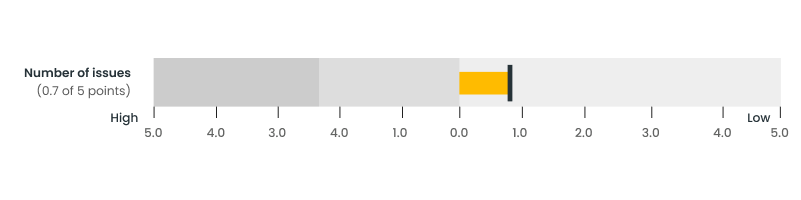
Number of Issues: This is a measure of the total number of unique, identified errors. If the errors that were occurring were analyzed to be the same, fixing only a few things would correct most or all of the errors, this would be closer to +5. The more numerous the closer to -5 this score would be.
We find this provides a well-balanced framework for assessing software quality. And our analytics and AI algorithms assure that the data generating the insights is objective.
Users impacted and the importance of “Context”
Clearly errors or defects impact software quality but all errors are not equal when it comes to prioritizing them for attention. And without classifying them effectively how do you know you are working on the most important errors first?
We talked about how a single Quality Index score is derived from five measures in this order of importance, Error Types, Users Impacted, Error Frequency, Context Impacted, and Number of Issues. Today we’ll focus on two fundamental factors that impact our Quality Index Score, Users Impacted and Context Impacted.
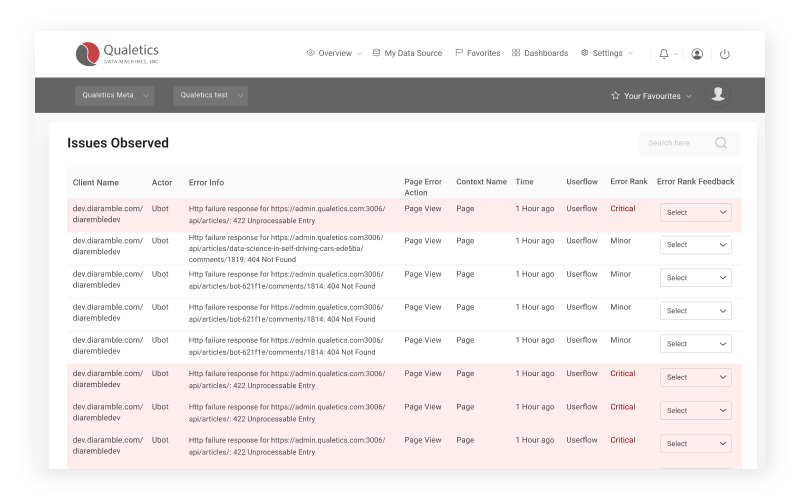
Let’s start with Users Impacted, a fairly straightforward metric. Because our plug-ins ingest every click a user makes for analysis we can identify who is taking what actions and we can associate those actions with errors when they occur. We analyze that activity and trap errors that occur either through our automated detection features or through error identifiers our customers can set when installing our plug-ins. We then associate the errors with the number of users impacted. And the more users an error impacts the more attention that error may deserve. That seems pretty straightforward.
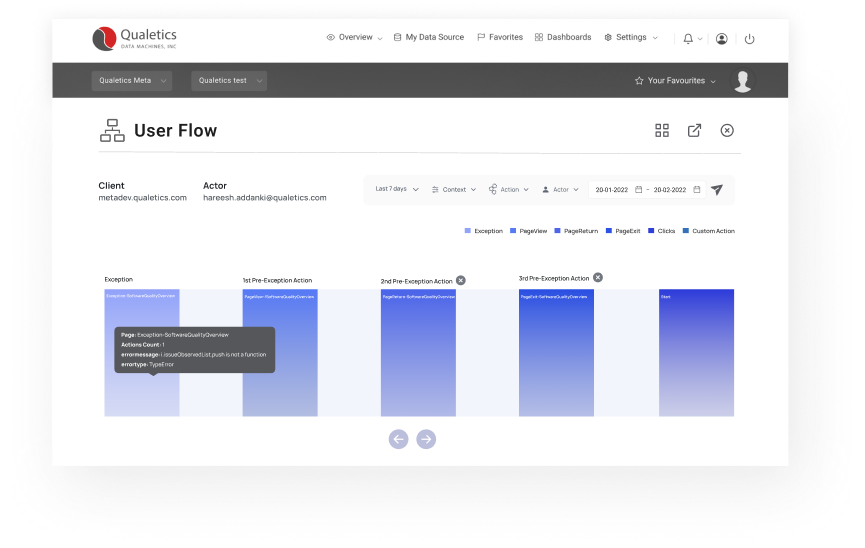
But as we said, all errors are not equal. Some errors may be annoying but may not interrupt the most important facets of the user experience. For instance, let’s consider if this were an eCommerce-focused mobile app’ and we identified two errors, one that impacted the checkout process for every iOS user, and another that interrupted the feature allowing a user to preview the cost of an express shipping option. The error classification algorithm would detect the importance of the checkout context as critical and the shipping lookup context as “minor”. This particular AI algorithm applies machine learning to learn the context of aspects of each software experience’s user flow to classify errors and offers our customers a feedback loop that can adjust the program’s learning to improve the classification results.
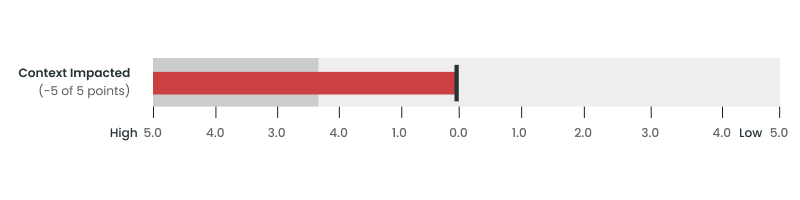
The image below shows the Context Impacted component of the Quality Index and in this customer example there was only one context impacted and it was a relatively insignificant part of the user experience.
With Users Impacted and Context Impacted objectively measured we have captured two of the five quality measures that make up our Quality Index giving our customers an objective measure of either positive or negative progress answering the question “How is our software doing?”.
But what can we understand about the defects themselves and how can that add to our understanding of software quality?
Error Types, Frequency and Count – Key Software Quality Indicators
The final three measures that go into the Quality Index, are Error Types, Error Frequency, and Number of Issues.
Our AI determines whether an error is critical, major, or minor as soon as an error is reported. Error types are weighted as the most important detail in the overall Quality Index. Again, the detail behind this visualization provides the decision-support needed to prioritize the right defects for attention.
Error Frequency is the third most important factor in our Quality Index score. The quality dashboard shows the error rate per user, per day, and per context, all of which have declined nicely over the previous period.
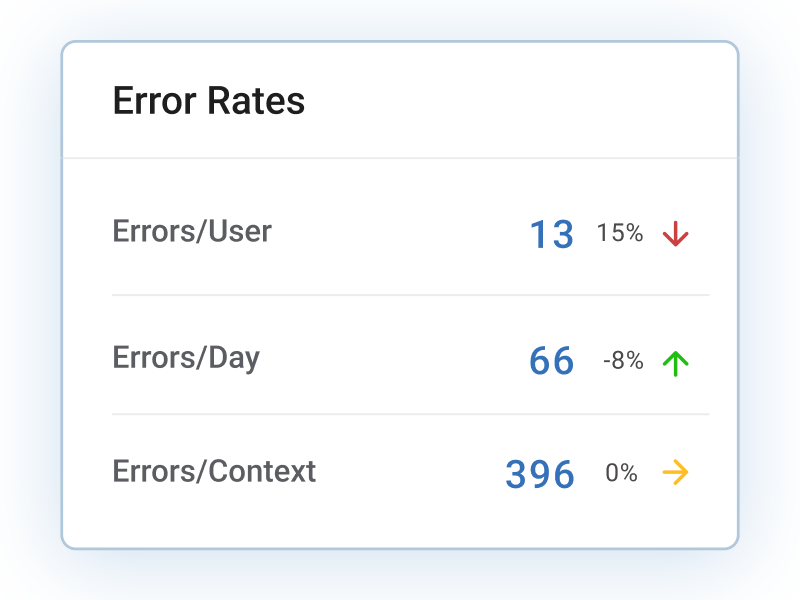
Because our plug-ins are ingesting all activity in a structured way we are recording and analyzing who is taking what action and when. By correlating the errors our error detection algorithm identifies with the user, day, and wherein the user flows the errors occur, we can report their rate relative to users, day, and context and how that is trending over the previous period.
With Error Types and Error Frequency objectively measured we are left with the final measure of the five quality measures that make up our Quality Index, the number of issues that are detected, and the total number of errors or defects detected.
By accurately ingesting and analyzing the data and rolling it up into a single, objective measure we make it easy to get a quick answer to the question “How is our software doing?”. And through our interactive visualizations, you have immediate access to the data behind the measures and a range of additional details that inform different functions in your business, development, product management, marketing, sales, and the executive leadership team.
Let us know what you think in the comments and please like or share this post if you find it interesting!