Live Analytics vs Real-Time Analytics - The Difference
It’s common to think about analytics in the context of analyzing what has happened to predict what will happen. This creates a tendency to spend time gathering historic data, as much as possible, to make your analysis more comprehensive and to improve your predictive accuracy. The time spent gathering and analyzing data creates an appreciation for the value of receiving analyzed results faster, what has been called “real-time analytics”.
Real-time analytics captures data in real time, analyzes this smaller set of recent data, and presents visualized results to deliver insights faster. But the inverse relationship between faster insights and in-depth analysis or accuracy persists, the more real-time data collected the more information available for analysis, which tends to make it less “real-time”.
Almost all real-time solutions would more accurately be described as living on a spectrum of “only slightly delayed analytics” that might be a minute or so delayed to “fairly recent analytics” reflecting conditions that occurred minutes or hours ago. Google Analytics’ own “Real-Time Reports” models recent activity that can be delayed by minutes.
What is “live data” for business?
“Live data” describes information with analytics value that is constantly changing. It is usually a stream of data coming from a source, like stock quotes, social media posts, or application usage data that is streamed.
Live data’s value for businesses holds the potential to inform decision making as the activity that generates the data happens. This allows businesses to remediate issues as they occur or act on trends while they are relevant. Businesses can use live data to make decisions about customer support, product development, pricing, and marketing strategies.
What is live data analytics?
Live data analytics are analyzed results extracted from the live data and delivered with immediacy. The qualifying factor is the timeliness of the insights. Where real-time analytics is delivered with some delay, live analytics’ results are delivered on a spectrum that ranges from within milliseconds to less than a minute.
For instance, if you want to understand how many people are in your application or website now and what are they doing as they are doing it, live analytics could answer that question, real-time analytics would tell you what that answer was minutes ago. Consider a healthcare example where a patient in-take procedure is informed by AI-enhanced live analytics that relies on capturing patient vitals to determine immediate health risk conditions. If the in-take procedure receives a prompt from a real-time algorithm it may detect the activity of symptoms and various vitals being captured then analyze them. Based on its assessment of the available data it may determine the patient’s temperature was missed and based on all the other symptoms captured it requires the temperature to validate an accurate diagnosis for the potential determination of an infectious disease. Returning a request to the in-take personnel to confirm the patient’s temperature a minute later after the patient was released to the general population waiting room creates risk that live analytics delivering the guidance in milliseconds would have prevented.
So live analytics delivers insights with immediacy, but what makes it actionable?
Most analytics solutions focus on delivering analyzed results visualized in a way that makes the insights inherent in the data more readily understood. Many people find this illuminating helping them understand conditions and informing their thinking. This has made Google Analytics so prominent. But very few analytics solutions go so far as to make their insights actionable.
Google’s Real-Time Reports will show you that someone was recently moving through your website and the path they took. That will give you insight into how it is being used and would show you that someone halted their experience at a certain page. You can view that activity as long as it’s very recent. It is real-time, not quite live analytics and it informs your thinking.
Contrast that with the live analytics example of the patient in-take experience above. In that scenario the individual user session is identified and you could observe the activity as it’s occurring on a dashboard similar to Google’s analytics dashboard. What can make that passive analytics experience actionable would be if you could use filters as part of a subscription and notification feature set that based on conditions that occurred low-code API calls could be pushed to other interfaces or processes to trigger necessary actions.
Using the healthcare example above of the patient in-take procedure, the live analytics solution identified a specific variable ingested from the healthcare interface returned no value, found that value to be important to the health assessment, and using a low-code API connection passed back to the healthcare interface a message within seconds prompting the in-take personnel that this patient’s temperature required validation to properly inform them of a potential infectious disease risk.
The ability to effectively structure the data upon ingestion helps the live analytics solution understand context, it informs an ability to filter for specific conditions, and insight is delivered to individuals or other systems and interfaces so that action can be triggered as it happens, in a “live” context, to the benefit of whatever important need is being addressed.
What are you missing by not having a live data analytics solution?
In short, the immediacy of actionable insights that can inform your business enabling your staff to be proactive in addressing business issues. Let’s consider this in the context of a product management and product development scenario that touches development, customer service, sales, and product management. In this scenario let’s consider this is a company with a SaaS solution that is relatively mature with an established customer base and like many companies they do their best to test new versions prior to release. Despite their best efforts bugs or undetected defects occur, customer support is on the front line identifying them post release as best they can providing feedback to development. Sales never likes to hear customer complaints resulting from product quality, and product managers do their best to understand how the product is used and how to shape the experience in a way that better suits your customer’s needs.
Product Development: The developers have been working on a new product and are now testing the product. They connect a live analytics software quality experience to their application in the testing environment and monitor the testing experience watching for defects that are detected. As they occur they can see who the tester was and what they were doing with context and action detail on a click-by-click level simplifying their ability to identify the source of the bug. They are also able to monitor performance by operating system and device to determine software stability in different software and hardware environments. If testing is occuring after hours and the developer is away from their desk, they can set notifications to inform them when defects of a certain severity, context, action, or hardware/software profile has happened. When a notification is triggered they can choose to review the details as they occur or come back to them when time allows, but with ready access to the details related to that instance.
Once the product is released into the production environment the same features support their ability to monitor the production release with live customers. In this scenario the development team is not left waiting to hear about customer complaints hitting the support queue and having to rely on the support staff’s ability to relay the pertinent details. They are notified as issues occur whether the client or the client’s users contact customer support or not. And they have access to all the details related to the detected defect.
Customer Support: On the day the new release goes live they start their day with their software quality analytics dashboard available on their screen. Those with assigned accounts are observing the activity from their client’s users monitoring for interesting new patterns of use with special attention on whether defects are being identified, where those defects are occuring in the system, and how they may be able to assist their users. As they occur they inform their manager and/or the development manager of any issues that occur asking for collaboration on either explaining the defect, fixing it, and any possible work around in the meantime. With guidance understood the customer support team has at their disposal the information to proactively reach out to those users affected offering an empathetic comment and more importantly proactive guidance that minimizes the impact of the negative experience the user had.
In short, this experience has enabled the customer support to be proactive in collaborating with development to address issues and mitigating any quality issues related to the release and give them access to insight that helps them collaborate in an informed way with the development team since they are all able to access the same software quality information.
Sales: Sales can also be given access to insights on their assigned client’s software utilization. As a result they can monitor the level of activity happening even to the level of paying attention to specific user’s activity they may know are internal gatekeepers or influencers. But nobody wants their salespeople glued to a screen watching user behavior, so the use of automated filters and notifications triggering alerts to them about key customer insights allows them to stay focused on their sales activity while being fully informed as issues occur, or they can access their dashboard for any pre-call or renewal planning. Salespeople could have access to any issues their users may be experiencing and would be able to communicate with their key contacts in an informed way about how things are going. Even to the extent of proactively reaching out to discuss how cleanly the new version is operating or if there is a bug that surfaced they can proactively communicate with their contacts about it, how much it’s affected their users, and what is being done about it.
Salespeople that want to stay informed so as not to be blindsided by product issues and want to be seen as consultative and proactive in product issues would have up-to-the-second insight as to how active their clients are and what their experience in their system is like. Again, this enables confident, proactive, collaborative behavior.
Product Management: Too often product management has to rely on conversations with customers, salespeople, and customer service staff about how they perceive the quality of software’s customer experience. A live analytics software quality solution that helps the product manager observe firsthand the quality of the pre-release testing environment experience allows them to fully participate in go/no-go conversations around product readiness. The ability to objectively observe and monitor customer adoption, user flow and friction points, latency issues, hardware/software compatibility, geographic user adoption, and defect detection are all critical to product management. And the ability to set notifications lets them stay constantly informed as to any critical insights that may occur while they are tending to other activities.
Product managers struggle to find tools that help them be proactive and communicate with a consistent baseline of data across development, customer support, and sales. A live analytics software quality solution like this allows them to understand their product better, align it with customer expectations, and continually measure and improve the quality of the experience.
Here are five key benefits of using live data analytics:
- Faster decision-making: Being presented with insights from data analyzed as its occurring allows you to get ahead of problems before they have time to snowball into bigger issues. You can also take maximum advantage of opportunities as they arise.
- Insights with context: Insights extracted from data lose some of their context when it’s a past event that’s being analyzed. Receiving insights on activity as it’s occurring allows you to immediately understand what is going on and why.
- Reduces risk of error: And because the insights are delivered as actions are occurring there is less guess-work about an interpretation of what happened in the past, your assessments are much more likely to be accurate, and would certainly be more timely.
- Move from being reactive to being proactive: You can see problems as they happen and take action before they become crises. The more you're able to do this, the more likely you’ll avoid increased costs or lost revenues.
- Better customer experience: By understanding what your customers want at any given point in time, you'll be able to deliver it faster and more efficiently than ever before. That means happier customers who stick around longer—and that's good for business!
Qualetics – An AI Powered Live Analytics Platform
Qualetics is an AI powered live data analytics platform delivering insights related to your applications – all by connecting to a single service. The platform is designed to help companies gain visibility into how their software is being used and is performing to continuously monitor and improve their customer experience.
The Qualetics solution structures data as it is ingested optimizing its analytics value. By applying AI and machine learning to analyze every click in every user’s experience and tracking the context and action the system learns to identify user friction and anomalies that identify defects and details around their origin. This machine learning is then applied as activity is occurring to deliver insights within milliseconds of user activity happening.
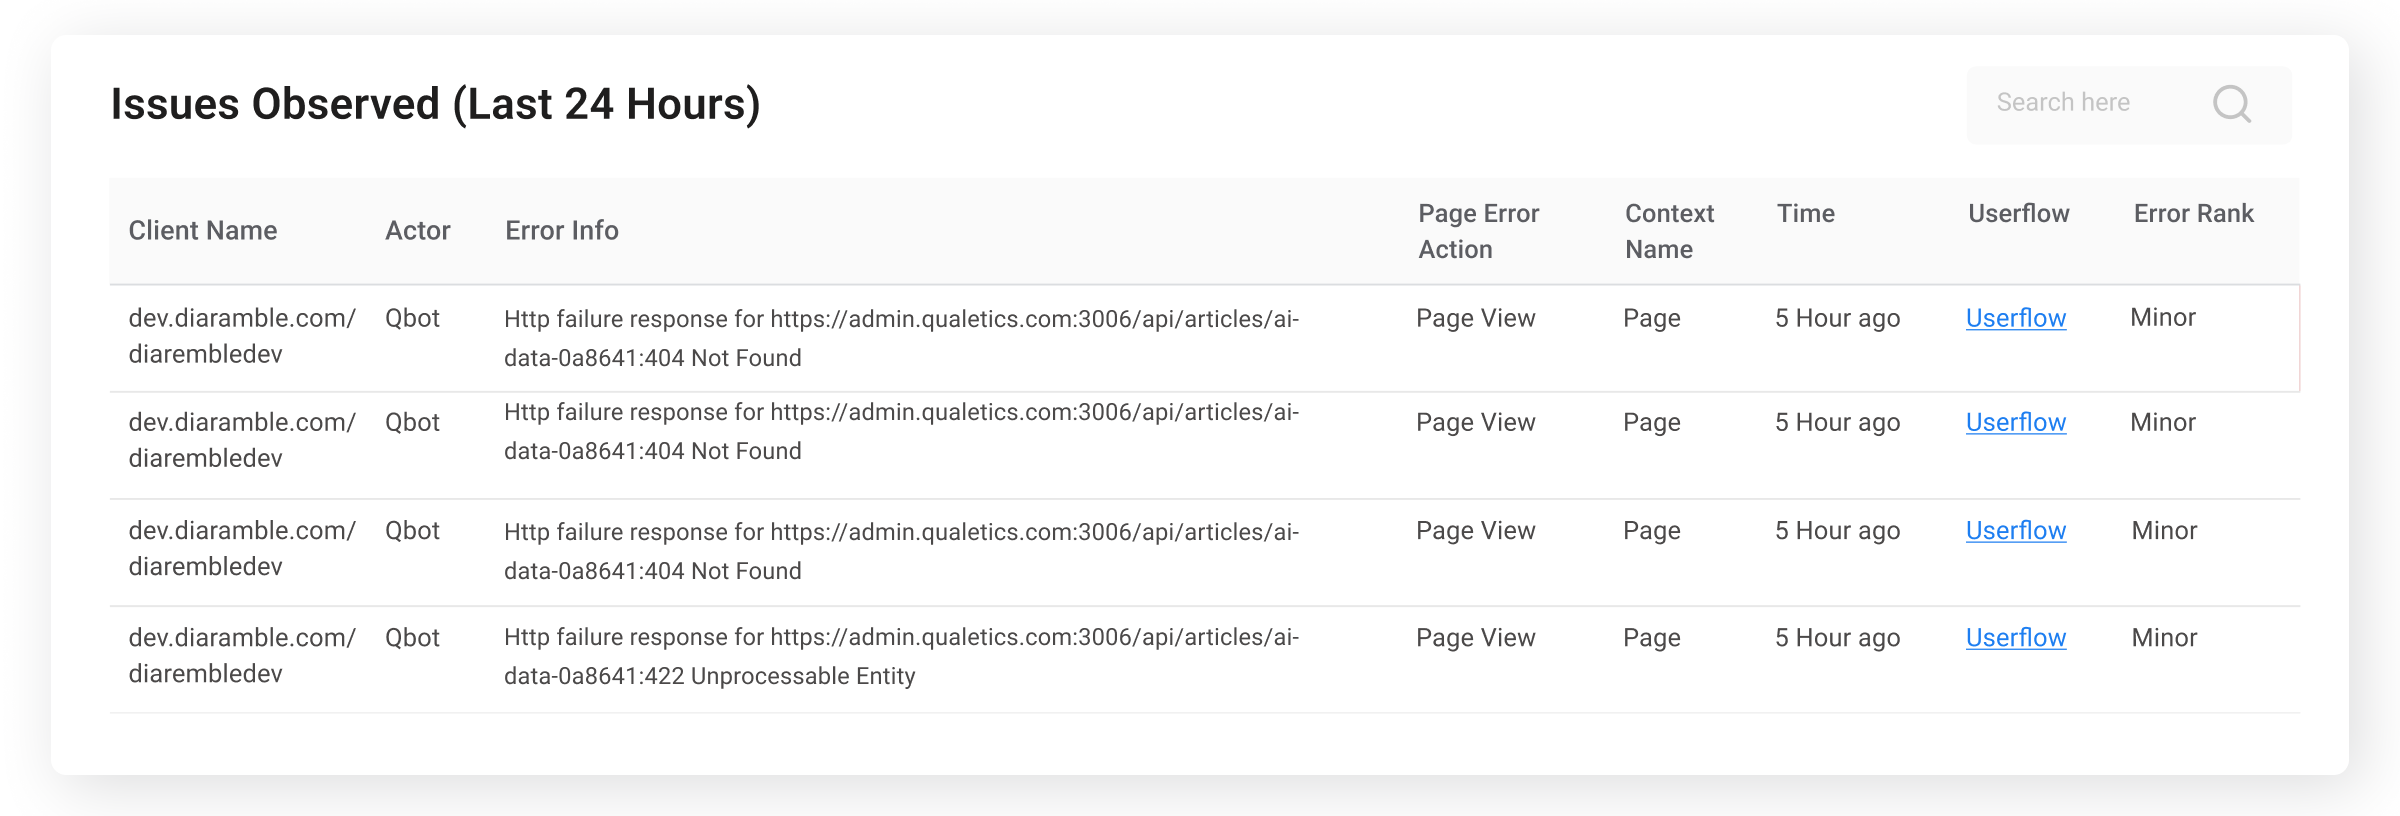
The Live Analytics dashboard offers different insights that not only display the user flow as it is occurring but who the users are engaged in current sessions, the time taken in each action, where they are coming from, their operating system and hardware, whether they are experiencing any anomalies or defects in their experience, it even classifies the errors into minor, major, and critical categories based on the context they occur in and the number of users impacts. Being developed as a multi-tenant solution that can also support multiple applications, websites, or mobile apps, you can selectively look at any individual client’s user activity, any users from a specific operating system or platform, or concentrate on analyzing activity from a specific app, website, or SaaS solution at a time.
Qualetics’ platform can be used by any business that wants to improve the quality of their digital products.