Analyzing Customer Engagement with Qualetics AI Management System
The key to the success of any product or service where the primary mode of engagement is digital interaction and the one important factor that the product owner has to be always aware of is Customer Engagement.
To define it in simple terms, Customer Engagement is the measure with which you can identify whether your product is drawing interest from your customers or users by measuring their rate of engagement with your solution over time.
Customer Success Investment
Understanding customer engagement should be the primary investment a company should make in order to improve Customer success and should not be left to guess work anymore. Traditionally, this is done with the help of surveys or more manual customer and client interactions but if there is a more fine tuned and granular approach to calculate the factors playing a role in customer engagement, companies will have better tools at their disposal to
- Identify the leading and lagging indicators of customer success,
- Predict customer churn,
- Improve customer retention and
- Reduce cancellation rate
What are those metrics?
While the final Engagement Score can be a single number easy to compare with your organization’s level of engagement over time or with other organization’s level of engagement,, the score itself needs to be composed of several sub-indicators of engagement that suggest your solution is being utilized and delivering value.
In a digital platform, there are several such metrics that can contribute to that score such as users counts, activity counts and goal completions. Specifically, here are some of the most common metrics that are used for measuring engagement of users in a digital platform.
Total Active & Inactive Users
This is the simplest metric where we calculate the Active and Inactive users as a percentage of the total number of users. Obviously the higher the active user number and higher the percentage, the better. Inactive users should be low and kept low over time as well.
Return & New Users
The next metric to calculate is the number of users being added to the platform while also measuring the number of users returning to use the platform. While both are crucial, one number indicates how well your platform attracts interest from new users and the other indicates how well that interest is sustained over time.
Screen & Activity Flow
This metric shows the amount of engagement your users are experiencing on average with screens (Web app) or actions (Mobile/SPA apps). This can be a tricky element to measure as not many systems are built to track every action of the user in a platform in a manageable way to extract insight from the data.
Time Spent (Total & Average)
This is the total time spent by users in the platform overall and also as an average per user. Needless to say, the higher both these numbers are, the better.
Frequency of Sessions
How frequent is an average user returning to use the application? Is it once per day, multiple times per day or once every couple of weeks. This is an important indicator of how much interest your application is able to generate in the eyes of the users. Once a baseline of activity is established this can provide an indication of how much more or less relevant users feel the system is to whatever it is they are trying to accomplish. This metric need not be the same for every platform. For a social media application, this needs to be as low as possible such as multiple visits per day, however for an ecommerce application, the frequency can be lower to a few days per user.
Goal Completions (Depending on the platform)
Let’s say there are a high number of active users, with a very high return rate, high screen/action flow, high total time and average time spent and visiting very frequently – the one metric that can upend these good numbers are goal completions. If you have an ecommerce application, you want users to buy your products regardless of the number of times they visit the store. Otherwise you’ve shown stronger research value than sales effectiveness.
Similarly, if you're a streaming media platform, you want your customers to engage with your content as completely as possible. Leaving content midway is bad versus completing the content and “liking” the content or providing a positive review representing an even more valuable engagement.
Clearly defining the engagement goal and measuring the level of achievement toward that goal is therefore a strong indicator of continuing engagement of users. Understanding this metric and evaluating it in depth provides the added benefit of identifying underlying value elements that are driving that higher engagement.
Great, how do we measure it?
As the points above illustrate, the most reliable way to measure user engagement is by capturing objective data on their activity. There are several products in the market that can enable you to capture user activity in various ways but you may be left to deal with calculating the scores yourself.
How did WE do it?
To those who are not familiar with the Qualetics AI Management System, we are a Data Analytics and AI platform specializing in continuous Data Collection, Data Analysis, Insight Generation and Insight Delivery to our customers.
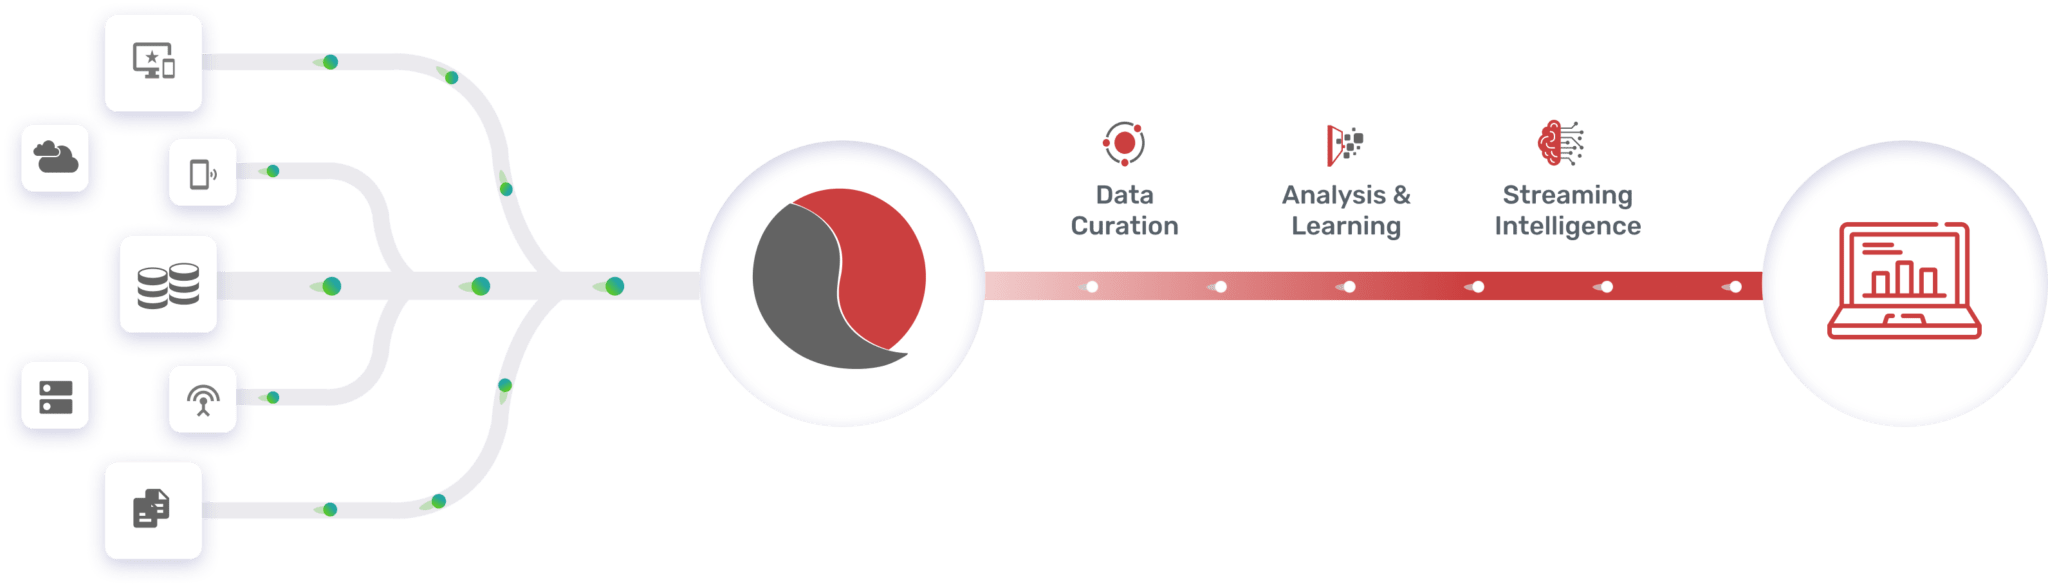
We recently developed the Engagement Score metric as part of our library of prebuilt analytics Data Machines available on our platform that our customers can benefit from. This is how we built it:
Continuous and Complete Data Collection
The Qualetics AI Management System provides a streaming API SDK that can be integrated with customer applications to identify user activity at a granular level by capturing the contextual information of not only the activity being performed but also the attributes related to that activity. This provides a continuous feed of data that provides a rich contextual representation of the activity undertaken by the users and the scenarios leading up to it.
Continuous Analysis
Each metric described above is measured by an individual routine that is continuously analyzing the data as it is streamed. These scores are then finalized and stored for each specific time period for easy lookup and further analysis
This is the most complex part as we split the activity into General and Custom, where General defines the basic activities such as Logging In, Visiting a page, visiting FAQs etc. Custom activities are those that are specific to the platform and our customers define as important to their specific customer experience. For example, an ecommerce store may have Product Listing Review, Product Ordering, Submitting a Review or requesting Customer Support Services. The Qualetics API enables our customers to track activity at such granular levels along with individual attributes to distinguish one event from another allowing a very thorough and detailed analysis.
Insights Generation & Delivery
All of the above is not meaningful if the product owner does not have the ability to track these metrics on a regular and consistent basis and observe them changing over time such as:
- Has the Inactive user score increased or decreased over the last measurement period?
- Are users completing more goals week over week?
- Is the average screen flow increasing or decreasing per week?
Seeing these metrics change across all customers over time is helpful, but being able to see them change on a customer-by-customer basis provides customer impact indicators that allow you to be proactive on many levels.
The Qualetics AI Management system has built in capabilities to generate these insights in a visual manner supported with outbound APIs. Product owners can interact with these insights daily and observe them by any classification as they desire. We also provide the scores accumulated over time as downloads if they want to export them to other tools for their own further analysis.
Here’s what the final output looks like if you are a multi-tenant platform supporting multiple clients.
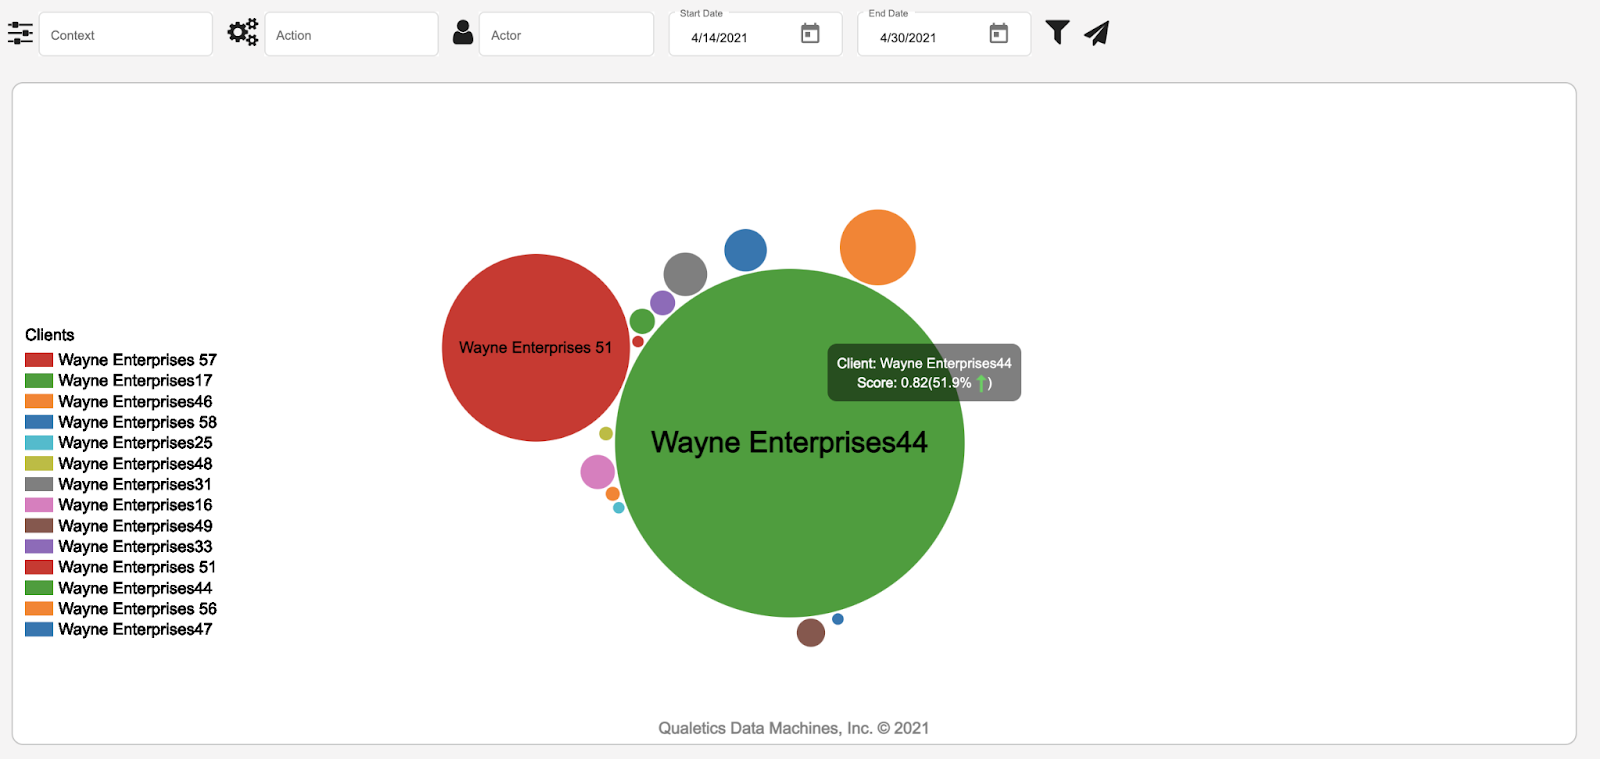
A bubble chart displaying the scores of clients corresponding to the size of the circle
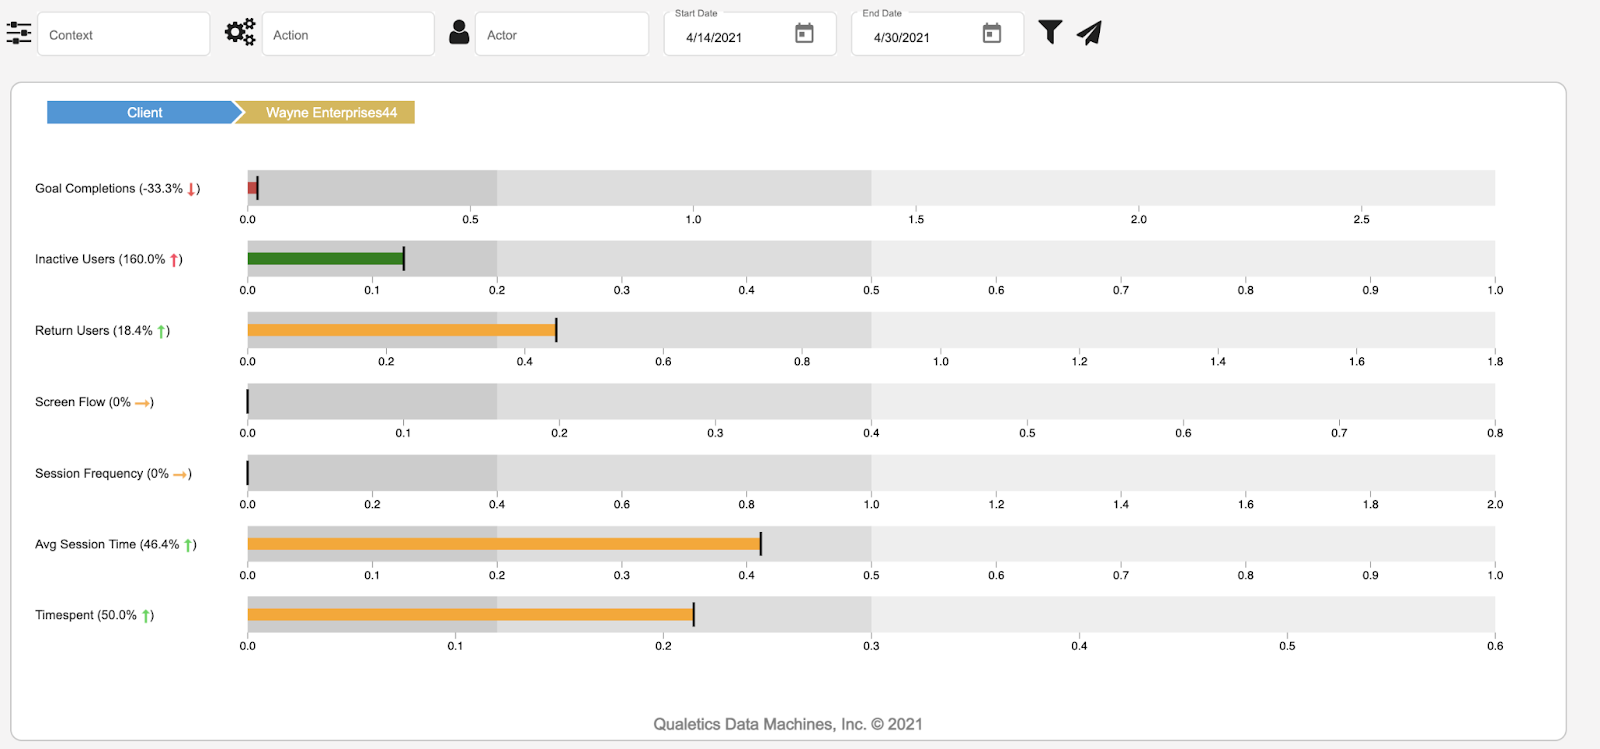
A visual grid that displays the breakdown of the scores of each individual area. Note that each metric has a different maximum value assigned by weightage of their importance with the total score adding up to a maximum of 10. This is an arbitrary number but once defined, this should be adhered to for consistency.
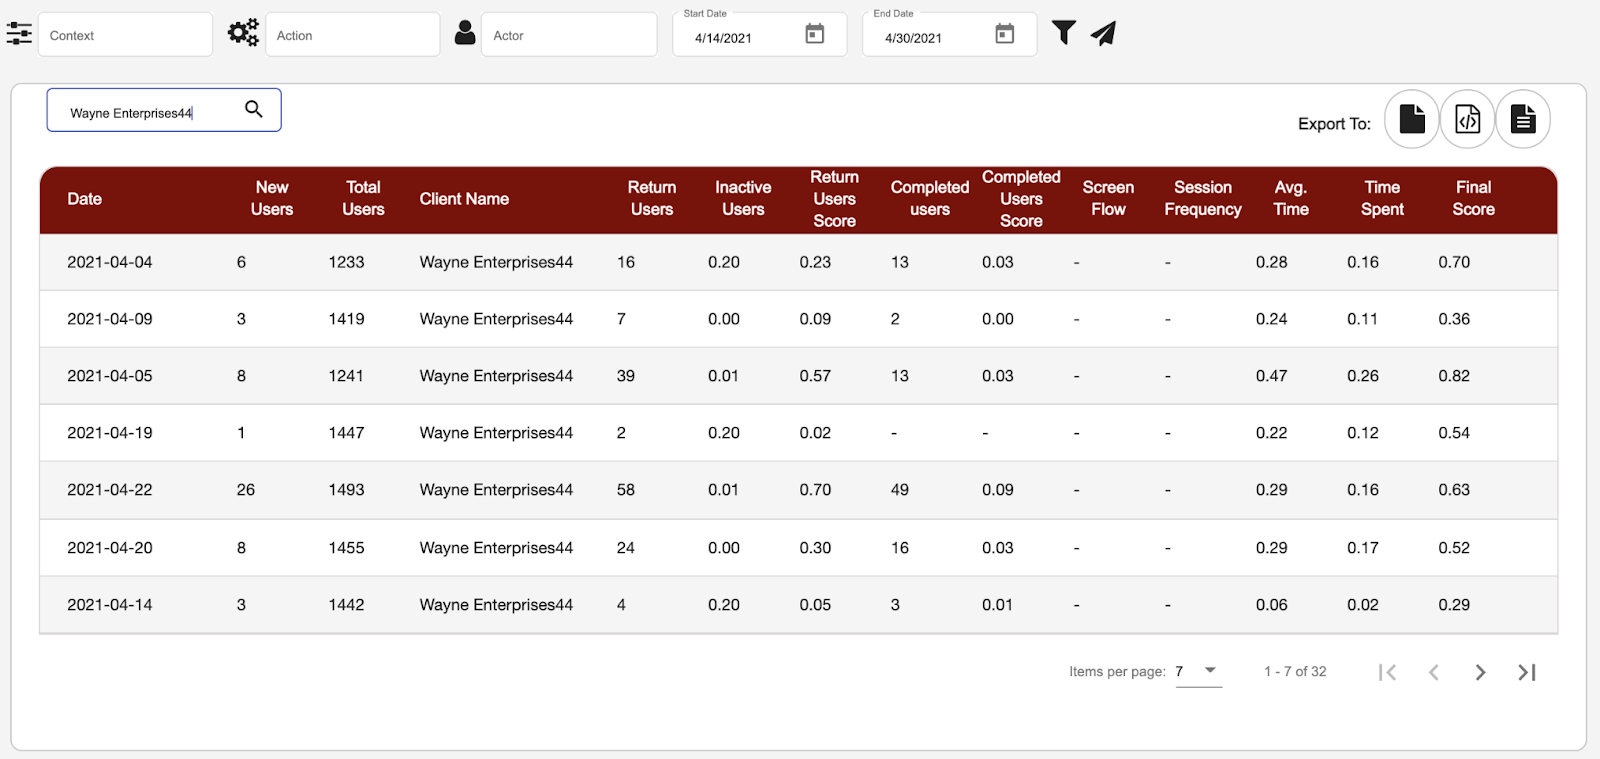
A breakdown of the actual values over time and over different customers.
What’s Next? – AI
So we have developed this series of analytics designed to measure user engagement keeping product owners informed of their solution’s impact as measured by user behavior, but where do we go from here? The obvious next step is to help the product owners validate the correlations between the various metrics and customer value. And depending on the solution and the needs it solves, we can analyze the data further looking for seasonality or cyclic patterns improving the depth of analytics value that is generated.
This will lead to the next step which is, given sufficient time and data, predictive and prescriptive insights that provide the early warning indicators providing the time and intelligence necessary to adequately plan, prepare and implement corrective actions before customers sense they’re needed.
Indicators of Success
Having a continuous and consistent measurement of the engagement scores enables us to then expand the analysis into identifying the lagging and leading indicators of Customer Engagement driving successful customer relationships. More importantly, they also will help identify the indicators that lead to failed, or successful, customer relationships.
Predicting churn rate… and even better… reducing it!
Being able to look into the future and identify customers on the verge of cancellation can now be done more accurately with the help of these metrics. While descriptive insights continuously analyzed provide perspective to the Customer Success managers and Product Managers, we can also predict the churn rate of customers. And once analytics have helped identify the behaviors that are the leading indicators to churn, prescriptive analytics can be developed to provide timely insights for reducing it
Domain and Action Specific Engagement Scores
The traditional way of capturing customer feedback about product usage has been done through surveys and feedback forms. You relied on the customer explaining how they used your solution. With the Qualetics AI Management System, surveys about user behavior can be completely eliminated and replaced with hyper focused data collection that is 100% complete and accurate. A Product Manager or Customer Success Manager can track specific actions or user behaviors over time correlating them with either customer retention or churn.
The Goal completion metric explained above can be further broken down into specific sub goals, for example, Add to Cart, Proceed to Checkout, Save for Later or Submission of a product question can all be process measure that lead to results measures or goal attainment, all of which can be measured, correlated, and used in predictive insights.
All of the above naturally then leads to prescriptive insights that provide specific recommendations to the Product and Customer Success Managers to drive engagement, success, and ultimately value for your customers and you!