
Healthcare Case Study: Analytics to Improve Diabetes Patient Care
One of the world’s largest hospital systems operates a chain of clinics dedicated to diabetes care and endocrinology, the science behind the human body’s ability to produce and regulate insulin. Their mission is to improve the lives of diabetic patients delivering optimal outcomes by combining comprehensive clinical care with sustained lifestyle management and behavioral modification.
Qualetics worked with this organization to improve operational and clinical decision making and patient care through enhanced analytics. This case study focuses on our approach to providing clinicians with insight on the effectiveness of different treatment options.
Challenge
There are two types of diabetes, Type 1 which represents about 5% of the world’s diabetes population where the body no longer produces its own insulin, and Type 2 representing about 95% of the world’s diabetes population where the body is resistant to insulin’s effects and over time, the pancreas eventually stops producing insulin. Patients with Type 1 diabetes can only be treated through insulin injection. Treatment for Patients with Type 2 diabetes that require intervention beyond weight management and diet changes can include pills, injectable medicines, or insulin.
The clinicians wanted to improve their ability to monitor diagnostic activity and results. Given their population and the range of treatment options the focus was on Type 2 patients to assess the type of treatment activity and monitor for effectiveness between insulin and oral treatments.
They had been conducting assessments on an ad hoc basis relying on IT resources to extract and organize the full range of data from various databases. The effort required to deliver the volume of selected data in the format requested was not insignificant. Then it would be analyzed using available software to query, sort, and organize it further to refine it further in order to extract intelligence clinic leadership and individual clinicians were interested in. Analyzing those details across the population on a frequent and regular basis was not practical and the data and tools used lacked the flexibility for non-technical staff to easily view the data at various levels, i.e. a company-wide view, clinic view, doctor view, patient view, visualized in ways that made the insights from the data more immediately understandable.
About the Dataset
Data at the patient level related to their doctor, clinic, treatments, and diagnostics were available in various databases and could be combined. As would be expected in a clinical setting various interfaces were updating these data elements regularly as a patient activity, testing, and treatments occurred. We received a broad sample of the current data set to begin our modeling work.
Solution
Our initial focus was to provide descriptive and diagnostics analytics on the efficacy of the various injected and oral treatments for Type 2 patients. The types of insights provided were identifying the most important diagnostics being performed for the patients in any given period and identifying an individual patient’s journey with their diagnostic evaluations.
The summary below for example shows the numbers of the different types of diagnostics performed in various centers of the organization in a two-month period.
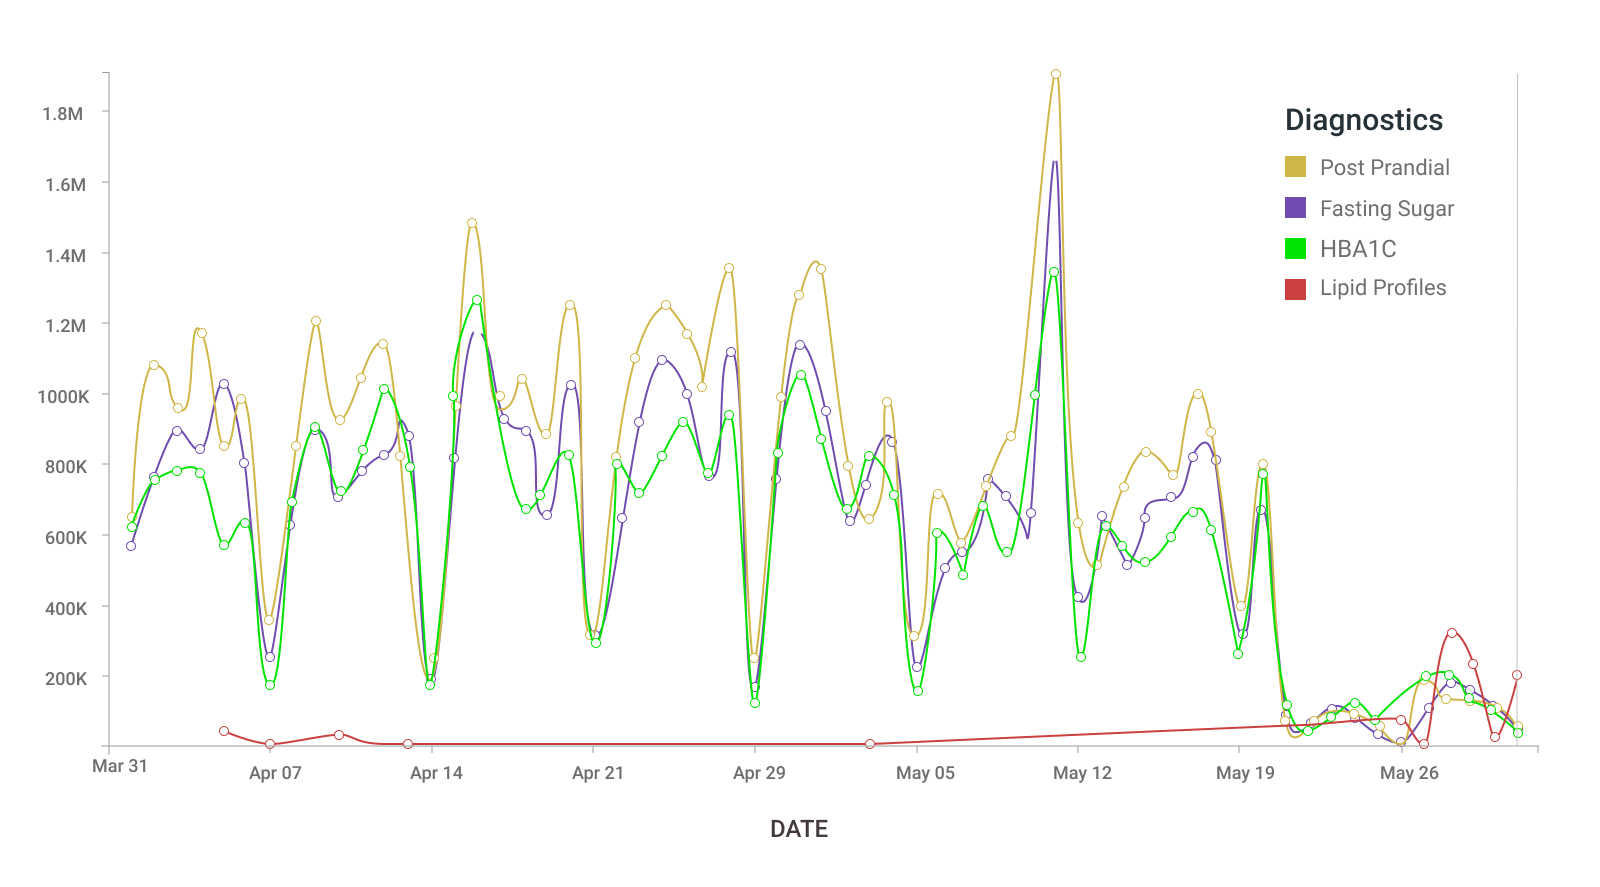 Fig.1. – Diagnostic Services
The visualization below is of a single patient’s diagnostic results over time. The color-coded circles in Red and Green indicate the positive and negative trends for the relative diagnostic results.
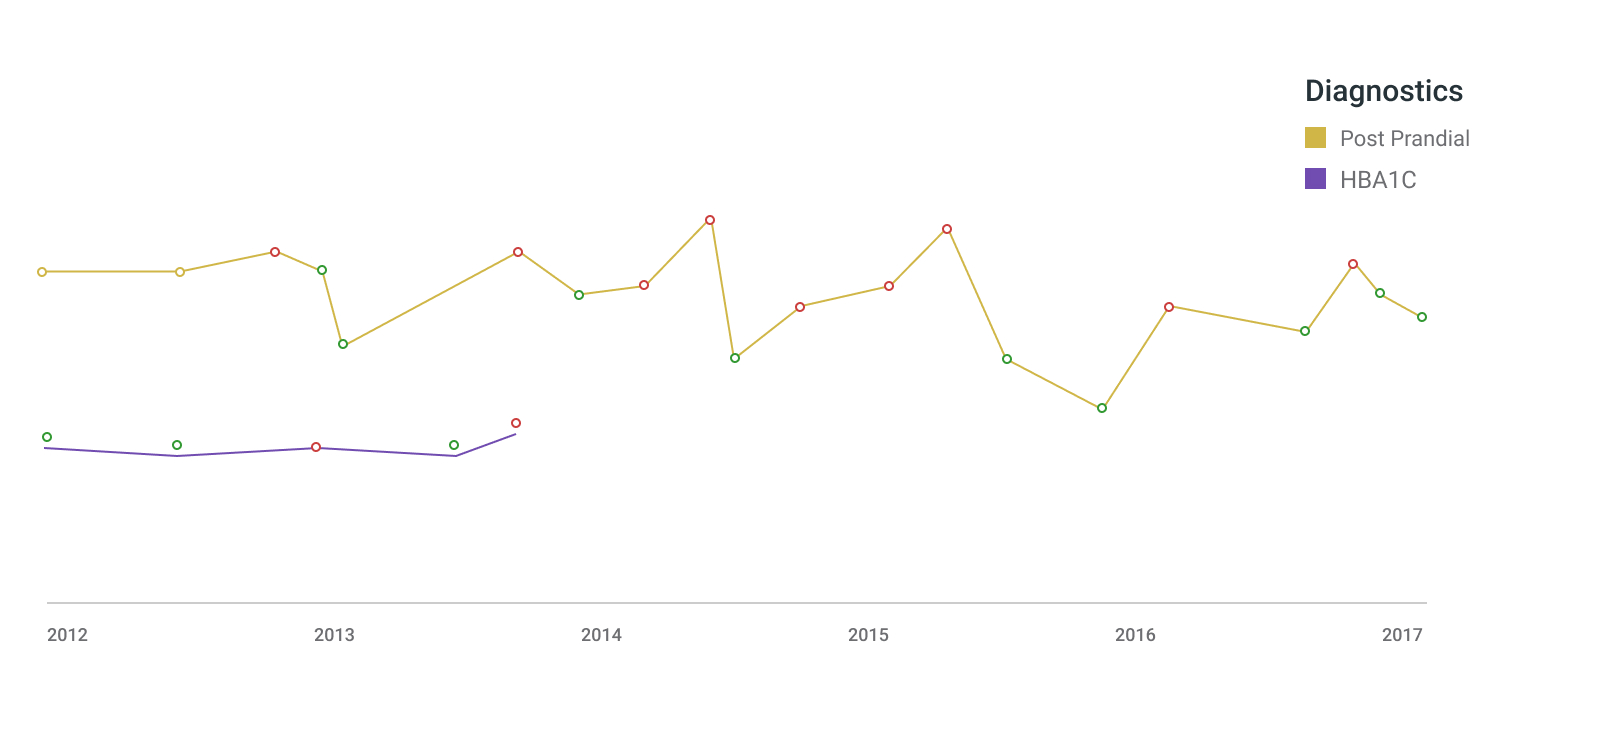
Fig 2. Individual Patient Diagnostic Journey
It’s also important for the organization to be able to readily access other visualizations, for example, to move from a single patient to all patients receiving the same treatment plan at that specific clinic, or perhaps all patients across the network with that treatment. And beyond access to the visualizations the ability to set user permissions for data access, for example, Doctors seeing their patients and not others, filters on the visualizations, and automated notifications when certain data conditions are met, data exports, etc. All the necessary features and delivery details you’d equate with a proper platform purpose-built for delivering analytics and AI algorithms.
In addition to other types of insights provided to the organization such as Patient Distribution across different regions and age groups, Patient and Clinical Service distribution by Regions, Specialities, and Doctors, the platform provided the capabilities necessary to deploy it across the enterprise giving valuable information to the administration and the care providers.
Continued Refinement
With descriptive and diagnostic enhancements validated and data streamed for a period of time predictive analytics can be developed projecting the probable range of future values for various insights. Depending on the insight being predicted it could provide clinical support suggesting to clinicians that barring changes in other factors what the projected future outcomes will be like, and as more historic data is analyzed the accuracy of those predictions will improve.
To simplify access to the core data presented in the visualizations a tabular view will be made available allowing the user to view, manipulate or print the data as though it were a standard reporting interface providing immediate access to the data related to any of the visualizations presented.